ppx_minidebug
ppx_minidebug: Debug logs for selected functions and let-bindings
ppx_minidebug traces let bindings and functions within a selected scope if they have type annotations. ppx_minidebug offers three ways of instrumenting the code: %debug_pp and %debug_show (also %track_pp, %diagn_pp and %track_show, %diagn_show), based on deriving.show, and %debug_sexp (also %track_sexp, %diagn_sexp) based on sexplib0 and ppx_sexp_conv. Explicit logs can be added with %log within a debug scope (%log is not a registered extension point to avoid conflicts with other logging frameworks). The syntax extension expects a function _get_local_debug_runtime in the scope (or a module Debug_runtime for extension points _o_ e.g. %debug_o_sexp). The ppx_minidebug.runtime library (part of the ppx_minidebug package) offers multiple ways of logging the traces, as helper functions generating Debug_runtime modules. See the generated documentation for Minidebug_runtime.
Take a look at ppx_debug which has complementary strengths!
Try opam install ppx_minidebug to install from the opam repository. To install the development version of ppx_minidebug, download it with e.g. gh repo clone lukstafi/ppx_minidebug; cd ppx_minidebug and then dune build; opam install ..
To use ppx_minidebug in a Dune project, add/modify these stanzas: (preprocess (pps ... ppx_minidebug)), and (libraries ... ppx_minidebug.runtime).
We can introduce ppx_minidebug runtimes in a project in multiple ways, but the most convenient is via the functions local_runtime, local_runtime_flushing, prefixed_runtime, prefixed_runtime_flushing. <!-- $MDX -->
let _get_local_debug_runtime = Minidebug_runtime.local_runtime "sync_to_md-introduction"
let%debug_sexp rec foo : int list -> int = function [] -> 0 | x :: xs -> x + foo xs
let (_ : int) = foo [ 1; 2; 3 ]
The logged traces will be pretty-printed as trees using the printbox package. This produces:
BEGIN DEBUG SESSION
foo = 6
├─"doc/sync_to_md.ml":5:73
├─<function -- branch 1> :: (x, xs)
├─x = 1
├─xs = (2 3)
└─foo = 5
  ├─"doc/sync_to_md.ml":5:73
  ├─<function -- branch 1> :: (x, xs)
  ├─x = 2
  ├─xs = 3
  └─foo = 3
    ├─"doc/sync_to_md.ml":5:73
    ├─<function -- branch 1> :: (x, xs)
    ├─x = 3
    ├─xs
    └─foo = 0
      ├─"doc/sync_to_md.ml":5:58
      └─<function -- branch 0> []
Traces in HTML or Markdown as collapsible trees
The PrintBox runtime can be configured to output logs using HTML or Markdown. The logs then become collapsible trees, so that you can expose only the relevant information when debugging. Example:
let _get_local_debug_runtime =
  Minidebug_runtime.local_runtime ~backend:(`Html Minidebug_runtime.default_html_config)
    "sync_to_md-simple_html"

let%debug_sexp rec foo : int list -> int = function [] -> 0 | x :: xs -> x + foo xs
let (_ : int) = foo [ 1; 2; 3 ]
This produces:
BEGIN DEBUG SESSION
<div><details><summary><span><span><span><a id="1"></a></span> <span><span style="font-family: monospace">foo = 6</span></span></span></span></summary><ul><li><div>"doc/sync_to_md.ml":14:73</div></li><li><table class="non-framed"><tr><td><a id="1"></a></td><td><div><function -- branch 1> :: (x, xs)</div></td></tr></table></li><li><pre style="font-family: monospace">x = 1</pre></li><li><pre style="font-family: monospace">xs = (2 3)</pre></li><li><details><summary><span><span><span><a id="2"></a></span> <span><span style="font-family: monospace">foo = 5</span></span></span></span></summary><ul><li><div>"doc/sync_to_md.ml":14:73</div></li><li><table class="non-framed"><tr><td><a id="2"></a></td><td><div><function -- branch 1> :: (x, xs)</div></td></tr></table></li><li><pre style="font-family: monospace">x = 2</pre></li><li><pre style="font-family: monospace">xs = 3</pre></li><li><details><summary><span><span><span><a id="3"></a></span> <span><span style="font-family: monospace">foo = 3</span></span></span></span></summary><ul><li><div>"doc/sync_to_md.ml":14:73</div></li><li><table class="non-framed"><tr><td><a id="3"></a></td><td><div><function -- branch 1> :: (x, xs)</div></td></tr></table></li><li><pre style="font-family: monospace">x = 3</pre></li><li><div>xs</div></li><li><details><summary><span><span><span><a id="4"></a></span> <span><span style="font-family: monospace">foo = 0</span></span></span></span></summary><ul><li><div>"doc/sync_to_md.ml":14:58</div></li><li><table class="non-framed"><tr><td><a id="4"></a></td><td><div><function -- branch 0> []</div></td></tr></table></li></ul></details></li></ul></details></li></ul></details></li></ul></details></div>
The backend will also convert the logged sexp values (with at least [boxify_sexp_from_size] atoms, default is 50) to trees. Example result: 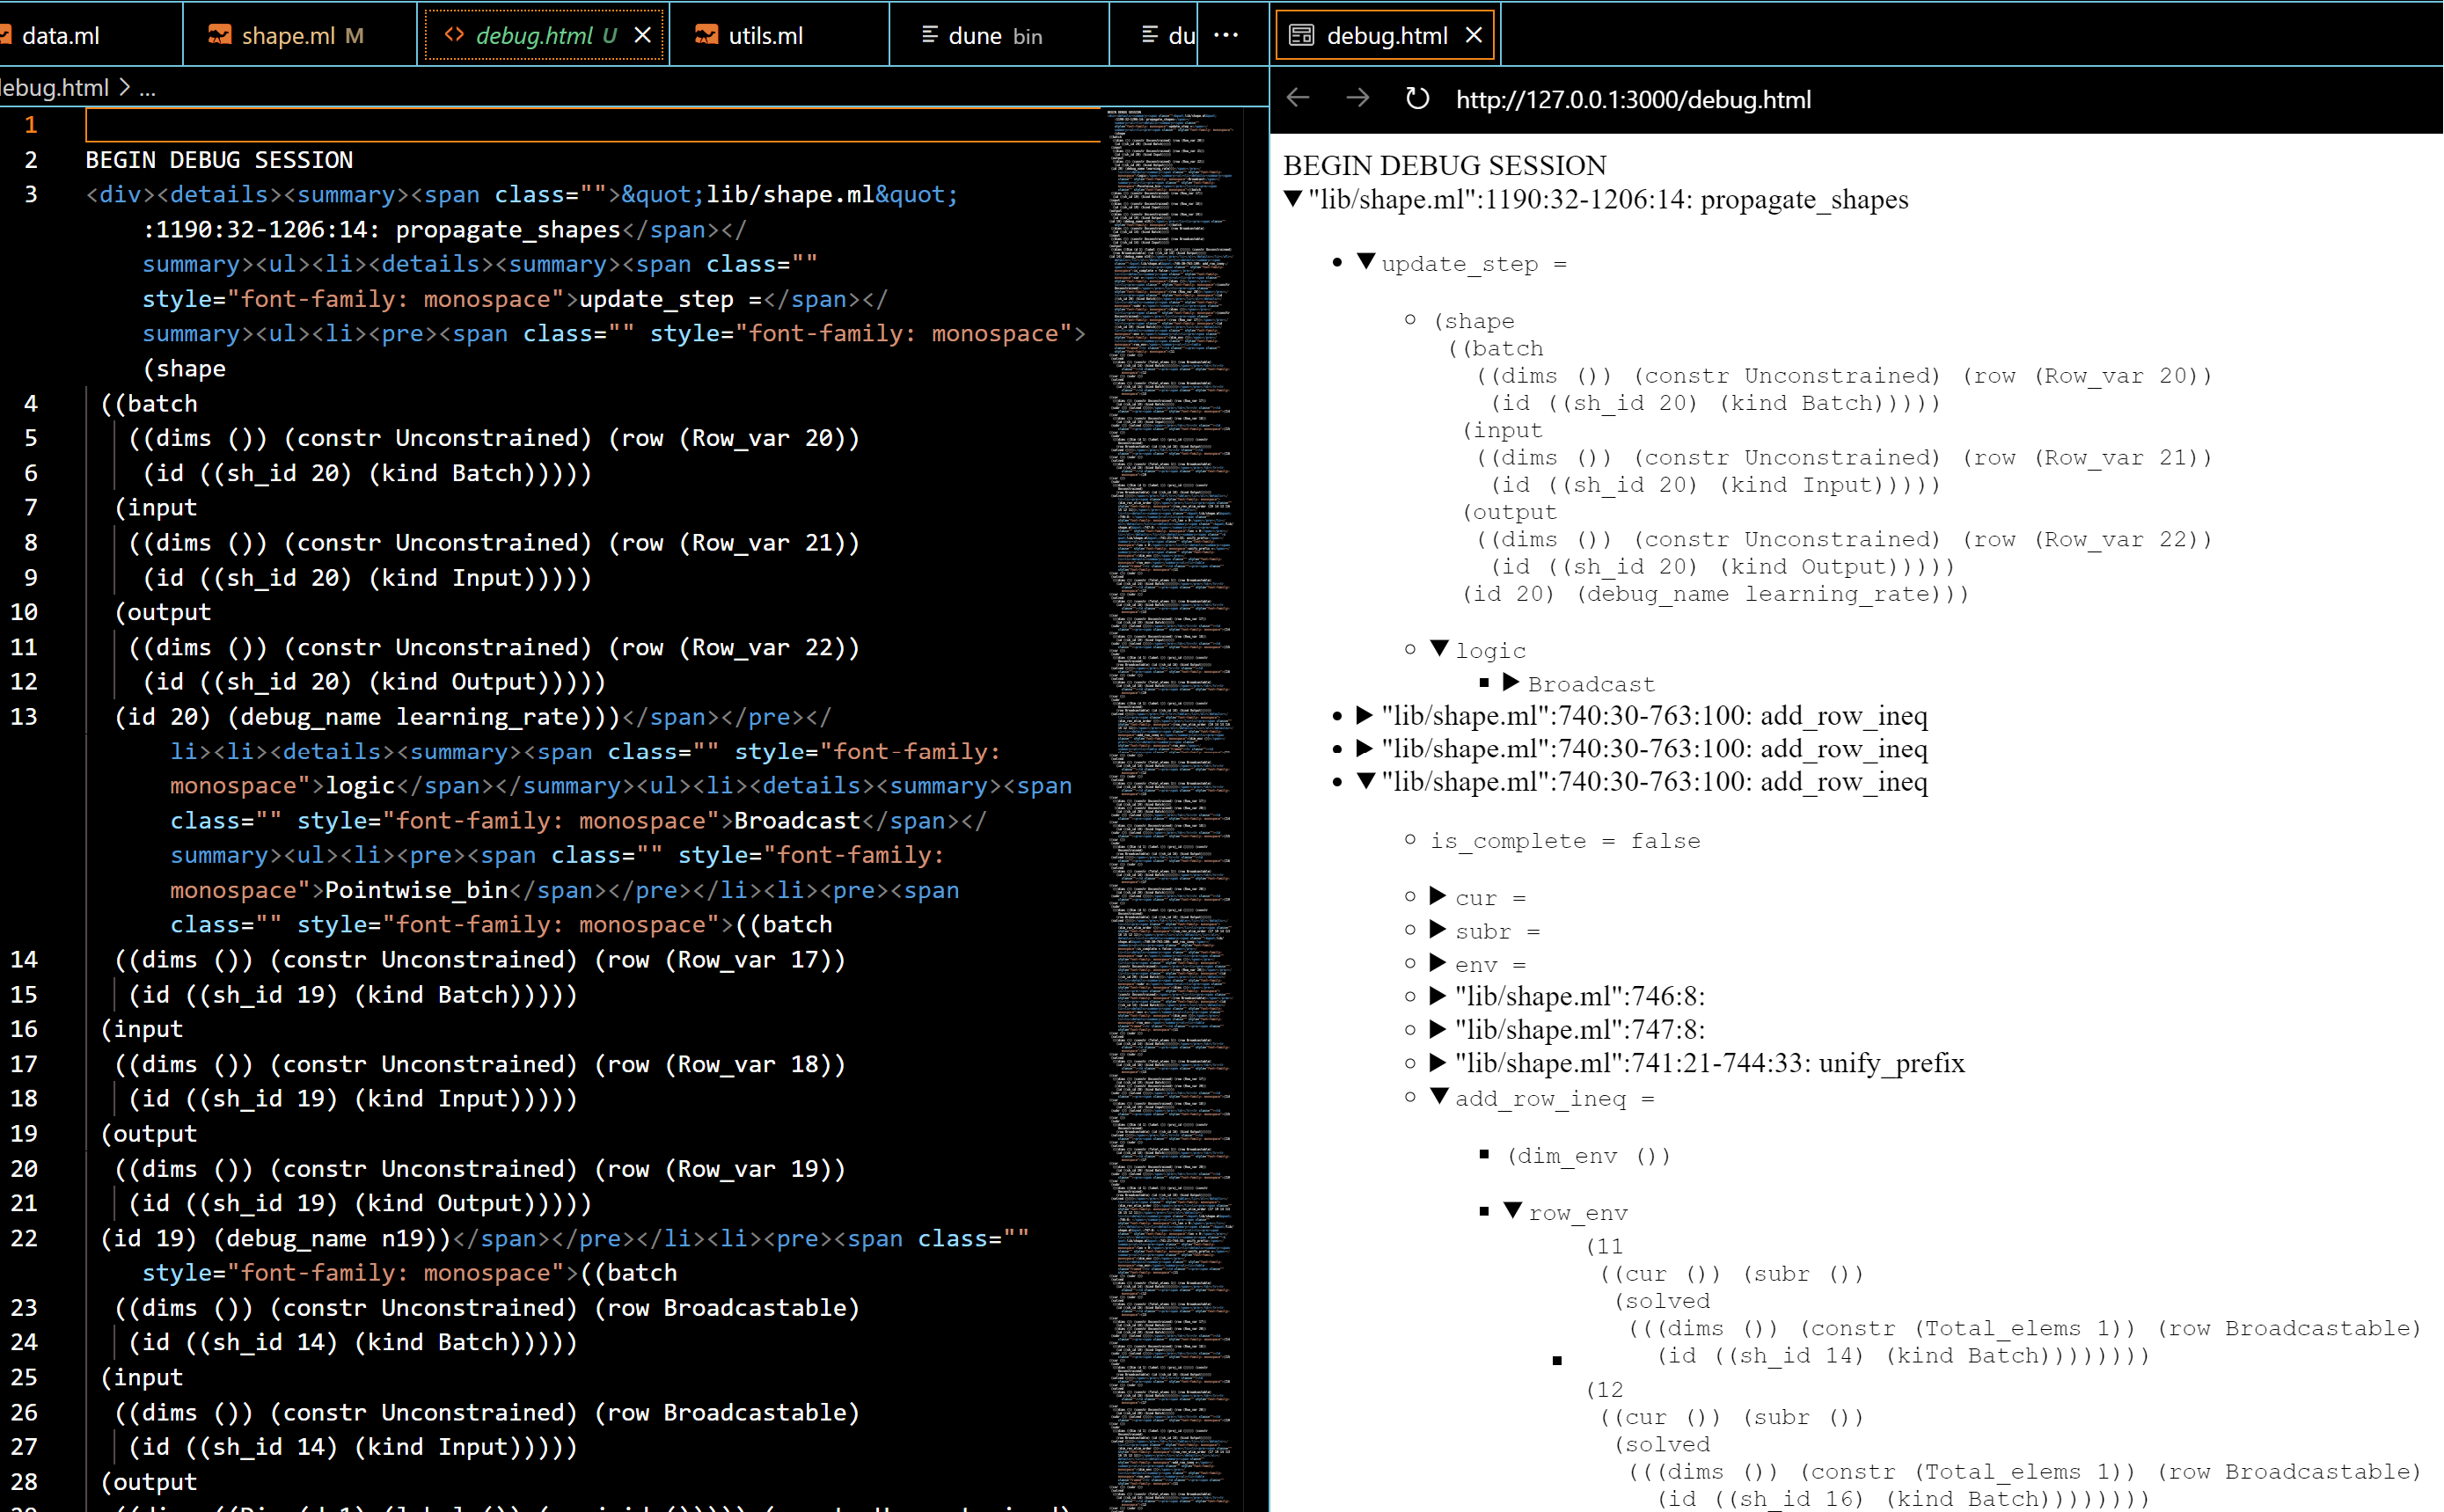
Highlighting search terms
The PrintBox runtime also supports highlighting paths to logs that match a highlight_terms regular expression. For example: 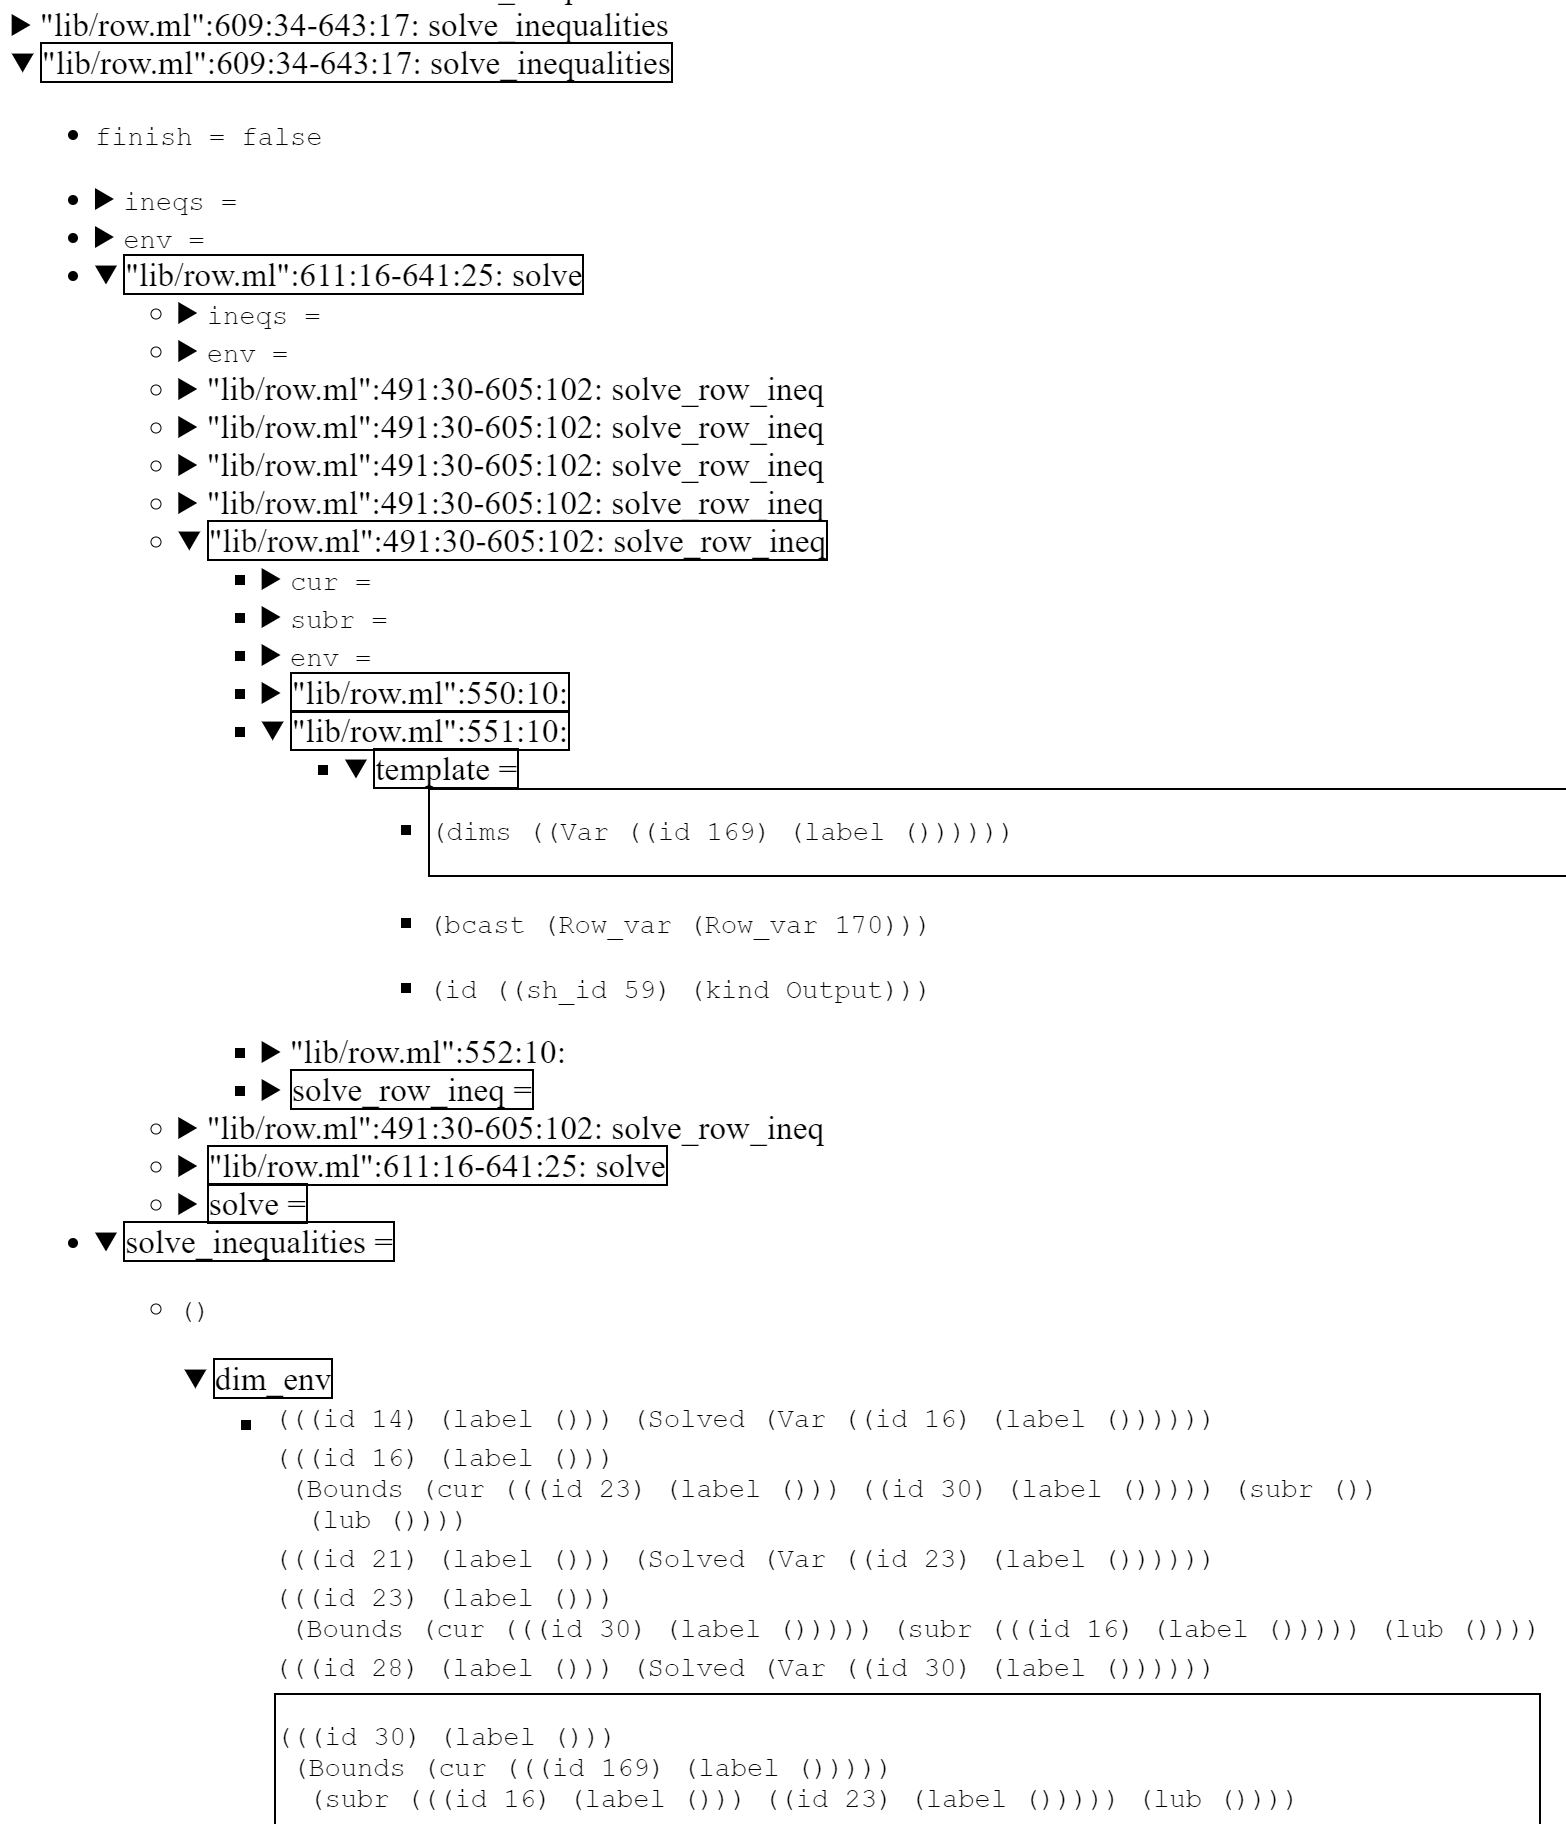
To limit the highlight noise, some log entries can be excluded from propagating the highlight status using the exclude_on_path setting. To trim excessive logging while still providing some context, you can set prune_upto to a level greater than 0, which only outputs highlighted boxes below that level.
Highlighting differences between runs
The PrintBox runtime can highlight differences between the current run and a previous run's logs. This is useful for understanding how program behavior changes between executions. To enable this feature, provide the prev_run_file argument when creating the runtime. It should be the "raw" messages file of the previous run, including the .raw suffix:
let _get_local_debug_runtime =
  Minidebug_runtime.local_runtime ~prev_run_file:"sync_to_md-introduction.raw"
    "sync_to_md-highlight_diffs"

let%debug_sexp rec foo : int list -> int = function [] -> 0 | x :: xs -> x + foo xs
let (_ : int) = foo [ 1; 5; 3; 4 ]
This produces:
BEGIN DEBUG SESSION
┌───────────────────────────────┐Changed from: xs = (2 3)
│┌────────┐Changed from: foo = 6│
││foo = 13│                     │
│└────────┘                     │
├───────────────────────────────┘
├─"doc/sync_to_md.ml":23:73
├─┬─────────────────────────────────┐Changed from: xs = (2 3)
│ │<function -- branch 1> :: (x, xs)│
│ └─────────────────────────────────┘
├─x = 1
├─┬────────────┐Changed from: xs = (2 3)
│ │xs = (5 3 4)│
│ └────────────┘
└─┬─────────────────────────────────┐Changed from: x = 2
  │┌────────┐Inserted in current run│
  ││foo = 12│                       │
  │└────────┘                       │
  ├─────────────────────────────────┘
  ├─"doc/sync_to_md.ml":23:73
  ├─┬─────────────────────────────────┐Changed from: x = 2
  │ │<function -- branch 1> :: (x, xs)│
  │ └─────────────────────────────────┘
  ├─┬─────┐Changed from: x = 2
  │ │x = 5│
  │ └─────┘
  ├─┬──────────┐Changed from: xs = 3
  │ │xs = (3 4)│
  │ └──────────┘
  └─┬──────────────────────────────┐Inserted in current run
    │┌───────┐Changed from: foo = 5│
    ││foo = 7│                     │
    │└───────┘                     │
    ├──────────────────────────────┘
    ├─"doc/sync_to_md.ml":23:73
    ├─┬─────────────────────────────────┐Inserted in current run
    │ │<function -- branch 1> :: (x, xs)│
    │ └─────────────────────────────────┘
    ├─x = 3
    ├─┬──────┐Inserted in current run
    │ │xs = 4│
    │ └──────┘
    └─┬──────────────────────────────┐Inserted in current run
      │┌───────┐Changed from: foo = 3│
      ││foo = 4│                     │
      │└───────┘                     │
      ├──────────────────────────────┘
      ├─"doc/sync_to_md.ml":23:73
      ├─┬─────────────────────────────────┐Inserted in current run
      │ │<function -- branch 1> :: (x, xs)│
      │ └─────────────────────────────────┘
      ├─┬─────┐Inserted in current run
      │ │x = 4│
      │ └─────┘
      ├─xs
      └─foo = 0
        ├─"doc/sync_to_md.ml":23:58
        └─<function -- branch 0> []
The highlighting of differences works independently from (and can be combined with) search term highlighting. The runtime will highlight entries that do not have a corresponding entry in the previous run: currently, deletions (previous run entries missing in the current run) do not affect the highlighting. Highlights comming from diffing runs are annotated with the diff reason (change or insertion). For a block-level highlight, the attached reason comes from the first diff encountered in the block. The ignore patterns are erased in the reason strings.
Note that the comparison is performed at the chunk level, where each chunk is a complete toplevel log tree. The log trees must match exactly: insertions and deletions of toplevel log trees are not supported. This limitation helps keep the comparison efficient but means you might have to coarsen the granularity of the log trees to get useful differences.
The diff_ignore_pattern setting can be used to ignore certain patterns in the logs. For example in the test suite, ignoring message-level timestamps:
  let _get_local_debug_runtime =
    Minidebug_runtime.local_runtime ~values_first_mode:false ~backend:`Text
      ~prev_run_file:"debugger_timestamps_run1.raw"
      ~diff_ignore_pattern:(Re.Pcre.re {|\[\d{4}-\d{2}-\d{2} \d{2}:\d{2}:\d{2}\]|})
      "debugger_timestamps_run2"
  in
Note that the timestamps of the log entries are not treated as messages, so are necessarily ignored.
For efficiency, the minimal edit distance search is limited, roughly speaking, to a band around the diagonal / greedy best match / forced match. The setting max_distance_factor controls the width of the band. (The implementation tweaks that heuristic somewhat to account for the tree structure.)
You can force aligning certain entry IDs via the setting entry_id_pairs. The previous run's entry IDs come first in the pairs. See the example test/debug_diffs_align.ml:
  let _get_local_debug_runtime =
    Minidebug_runtime.local_runtime ~values_first_mode:false ~print_entry_ids:true
      ~backend:`Text ~prev_run_file:(prev_run ^ ".raw")
      ~entry_id_pairs:[ (2, 4); (8, 6) ]
        (* Force mappings: - Entry 2 (early prev) to Entry 4 (middle curr) - Entry 8 (late
           prev) to Entry 6 (in the shorter curr) *)
      curr_run
  in
Overview of runtime creating helpers
Binding _get_local_debug_runtime to a result of the _runtime functions is the suggested way of providing debug runtimes, since it is aware of multithreaded contexts. The local_ functions log to different files from different threads, while the prefixed_ functions log to the single channel debug_ch, and by default to standard output. The _flushing functions have limited functionality (don't use PrintBox) but output messages immediately.
Hyperlinks to source locations
The HTML and Markdown outputs support emitting file locations as hyperlinks. For example:
let _get_local_debug_runtime =
  Minidebug_runtime.local_runtime ~hyperlink:"../" ~toc_specific_hyperlink:"./"
    ~with_toc_listing:true
    ~backend:(`Html PrintBox_html.Config.(tree_summary true default))
    "debugger_sexp_html"
where ~hyperlink is the prefix to let you tune the file path and select a browsing option. For illustration, the prefixes for Markdown / HTML outputs I might use at the time of writing:
values_first_mode
This setting, by default true, puts the result of the computation as the header of a computation subtree, rather than the source code location of the computation. I recommend using this setting as it reduces noise and makes the important information easier to find and visible with less unfolding. Another important benefit is that it makes hyperlinks usable, by pushing them from the summary line to under the fold. It is the default setting, but can be disabled by passing ~values_first_mode:false to runtime builders, because it can be confusing: the logs are no longer ordered by computation time. It is not available in the _flushing runtimes.
For example, the diffs example we saw before:
  let _get_local_debug_runtime =
    Minidebug_runtime.local_runtime ~values_first_mode:false ~backend:`Text
      ~prev_run_file:"debugger_timestamps_run1.raw"
      ~diff_ignore_pattern:(Re.Pcre.re {|\[\d{4}-\d{2}-\d{2} \d{2}:\d{2}:\d{2}\]|})
      "debugger_timestamps_run2"
  in
leads to:
BEGIN DEBUG SESSION
"test/test_debug_timestamps.ml":23:33: process_message
├─msg = "hello"
├─"test/test_debug_timestamps.ml":24:8: timestamp
│ └─timestamp = "[2024-03-22 15:30:45] "
├─"test/test_debug_timestamps.ml":25:8: processed
│ └─processed = "[2024-03-22 15:30:45] Processing: hello"
└─process_message = 39
When logging uses sexps and boxification, and the result is decomposed into a subtree, only the header of the result subtree is put in the header line, and the rest of the result subtree is just underneath it with a <returns> or a <values> header. Example showcasing the printbox-html backend: 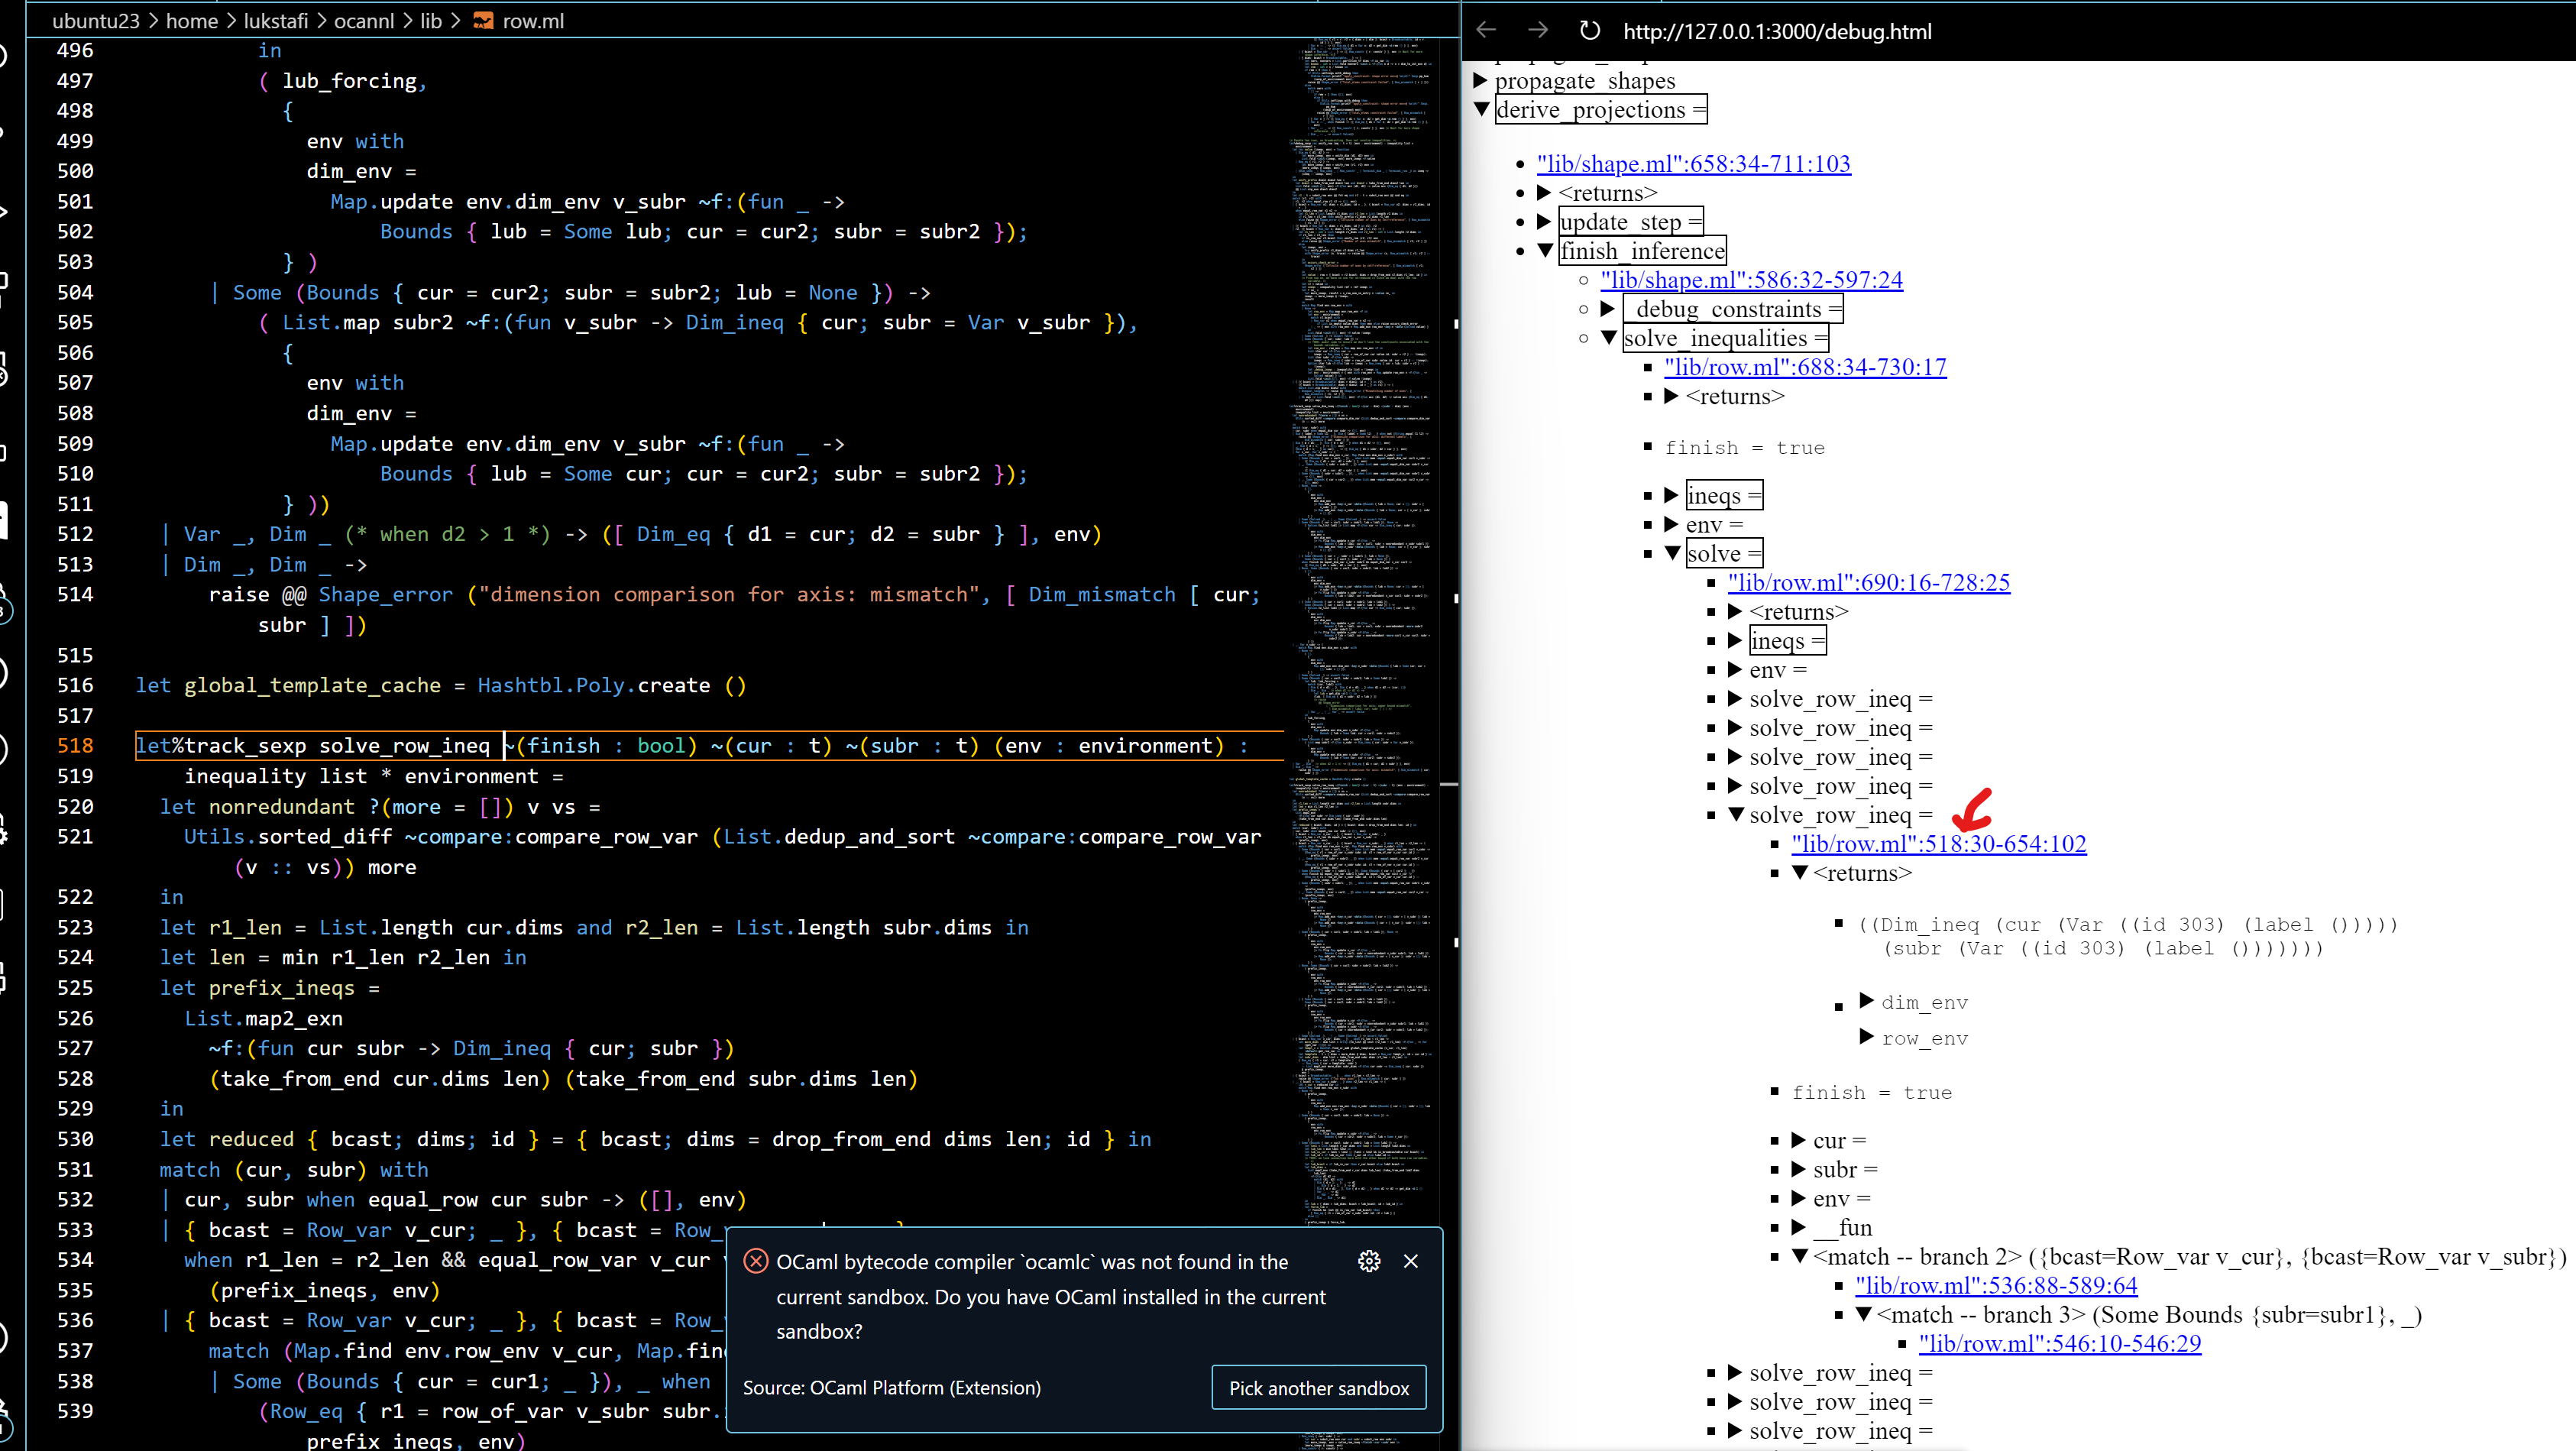
Example showcasing the printbox-md (Markdown) backend: 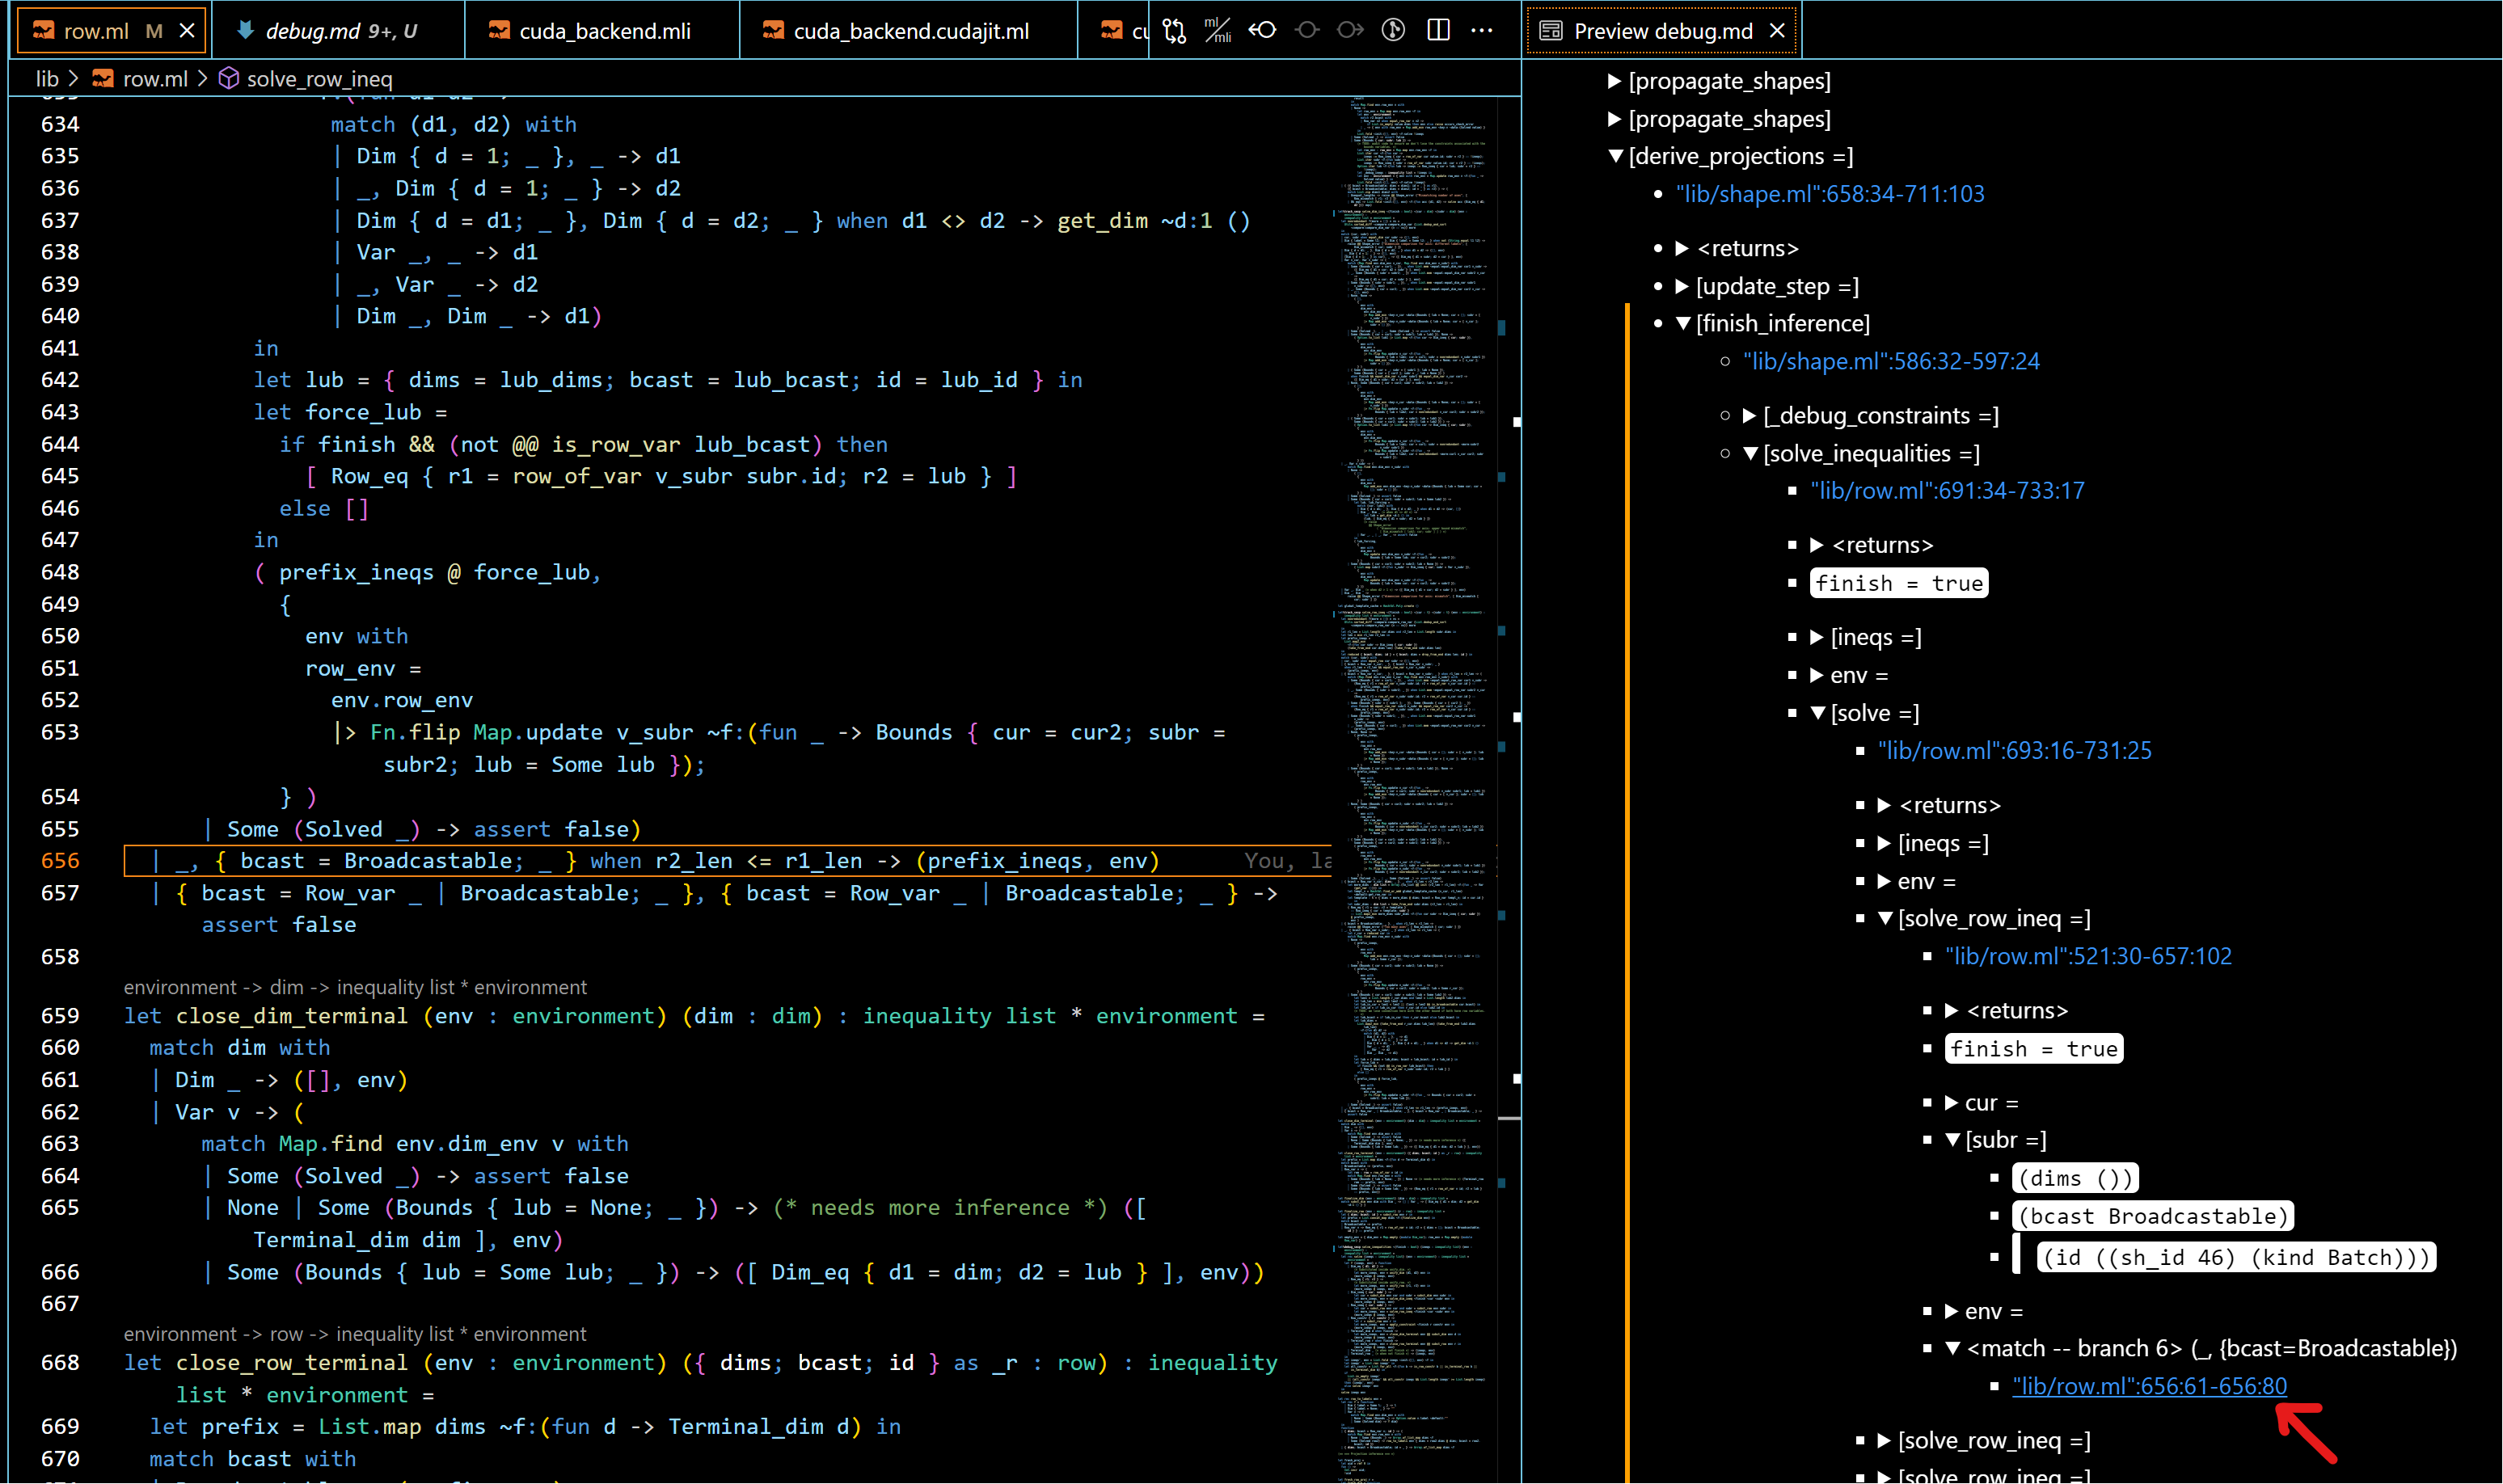
Usage
Tracing only happens in explicitly marked lexical scopes. For extension points applied directly to bindings (let-definitions) only the let definition in scope for logging, the body of the definition(s) is considered outside the extension point. (But if the extension is over an expression with a nested let-binding, the body of the definition is in the scope of the extension.)
The entry extension points vary along three axes:
%debug_ vs. %track_ vs. %diagn_
- The prefix
%debug_ means logging fewer things: only let-bound values and functions are logged, and functions only when either: directly in a %debug_-annotated let binding, or their return type is annotated. %track_ also logs: which if, match, function branch is taken, for and while loops, and all functions, including anonymous ones.- The prefix
%diagn_ means only generating logs for explicitly logged values, i.e. introduced by [%log ...], [%log_result ...], [%log_printbox ...] statements.
Optional infixes _rt_ and _l_:
_rt_ adds a first-class module argument to a function, and unpacks it as module Debug_runtime for the scope of the function._l_ calls _get_local_debug_runtime, and unpacks it for the scope of the function: let module Debug_runtime = (val _get_local_debug_runtime ()) in ....- This functionality is "one use only": it applies only to the function the extension point is attached to.
Representation and printing mechanism: _pp, _show, recommended: _sexp
_pp is currently most restrictive as it requires the type of a value to be an identifier. The identifier is converted to a pp_ printing function, e.g. pp_int._show converts values to strings via the %show extension provided by deriving.show: e.g. [%show: int list]._sexp converts values to sexp expressions first using %sexp_of, e.g. [%sexp_of: int list]. The runtime can decide how to print the sexp expressions. The PrintBox backend allows to convert the sexps to box structures first, with the boxify_sexp_from_size setting. This means large values can be unfolded gradually for inspection.
Plus, there are non-entry extension points %log, %log_printbox and %log_result for logging values. They are not registered, which as a side effect should somewhat mitigate conflicts with other ppx extensions for logging. There's also an un-registered extension points %log_entry and %log_block for opening a log subtree; %log_entry is for arbitrary computations whereas %log_block's body is for logging purposes only.
See examples in the test directory, and especially the inline tests.
Only type-annotated let-bindings, function arguments, function results can be implicitly logged. However, the bindings and function arguments can be nested patterns with only parts of them type-annotated! The explicit loggers %log and %log_result take a value and reconstruct its type from partial type annotations (deconstructing the expression), sometimes assuming unknown types are strings. The %log_printbox logger takes a PrintBox.t value. The %log_entry and %log_block loggers takes a string value for the header of the log subtree.
To properly trace in concurrent settings, ensure that different threads use different log channels. For example, you can bind Debug_runtime locally: let module Debug_runtime = Minidebug_runtime.debug_file thread_name in ... Extension points with the _l_ or _rt_ infixes are a great help for that, e.g. %debug_l_sexp; see: Dealing with concurrent execution.
To ensure that log files are properly closed, you can use Minidebug_runtime.finish_and_cleanup at the end. This is typically not needed (and is more helpful on Windows, where a log file might remain locked after a process exits without closing it).
ppx_minidebug can be installed using opam. ppx_minidebug.runtime depends on printbox, ptime, mtime, sexplib0.
Breaking infinite recursion with max_nesting_depth and looping with max_num_children; flushing-based traces
PrintBox-based runtimes only produces any output when a top-level log entry gets closed. This makes it harder to debug infinite loops and especially infinite recursion. The setting max_nesting_depth terminates a computation when the given log nesting is exceeded. For example:
  let _get_local_debug_runtime =
    Minidebug_runtime.prefixed_runtime ~values_first_mode:false ()
  in
  let%debug_show rec loop_exceeded (x : int) : int =
    [%debug_interrupts
      { max_nesting_depth = 5; max_num_children = 1000 };
      let z : int = (x - 1) / 2 in
      if x <= 0 then 0 else z + loop_exceeded (z + (x / 2))]
  in
  let () =
    try print_endline @@ Int.to_string @@ loop_exceeded 7
    with _ -> print_endline "Raised exception."
  in
  [%expect
    {|
    BEGIN DEBUG SESSION
    "test/test_expect_test.ml":332:35: loop_exceeded
    ├─x = 7
    ├─"test/test_expect_test.ml":335:10: z
    │ └─z = 3
    └─"test/test_expect_test.ml":332:35: loop_exceeded
      ├─x = 6
      ├─"test/test_expect_test.ml":335:10: z
      │ └─z = 2
      └─"test/test_expect_test.ml":332:35: loop_exceeded
        ├─x = 5
        ├─"test/test_expect_test.ml":335:10: z
        │ └─z = 2
        └─"test/test_expect_test.ml":332:35: loop_exceeded
          ├─x = 4
          ├─"test/test_expect_test.ml":335:10: z
          │ └─z = 1
          └─"test/test_expect_test.ml":332:35: loop_exceeded
            ├─x = 3
            └─"test/test_expect_test.ml":335:10: z
              └─z = <max_nesting_depth exceeded>
    Raised exception.
    |}]
Similarly, max_num_children raises a failure when the given number of logs with the same parent is exceeded. For example:
    let module Debug_runtime = (val _get_local_debug_runtime ()) in
    try
      let%debug_o_show _bar : unit =
        [%debug_interrupts
          { max_nesting_depth = 1000; max_num_children = 10 };
          for i = 0 to 100 do
            let _baz : int = i * 2 in
            ()
          done]
      in
      ()
    with Failure s -> print_endline @@ "Raised exception: " ^ s
  in
  [%expect
    {|
    BEGIN DEBUG SESSION
    "test/test_expect_test.ml":377:23: _bar
    ├─"test/test_expect_test.ml":381:16: _baz
    │ └─_baz = 0
    ├─"test/test_expect_test.ml":381:16: _baz
    │ └─_baz = 2
    ├─"test/test_expect_test.ml":381:16: _baz
    │ └─_baz = 4
    ├─"test/test_expect_test.ml":381:16: _baz
    │ └─_baz = 6
    ├─"test/test_expect_test.ml":381:16: _baz
    │ └─_baz = 8
    ├─"test/test_expect_test.ml":381:16: _baz
    │ └─_baz = 10
    ├─"test/test_expect_test.ml":381:16: _baz
    │ └─_baz = 12
    ├─"test/test_expect_test.ml":381:16: _baz
    │ └─_baz = 14
    ├─"test/test_expect_test.ml":381:16: _baz
    │ └─_baz = 16
    ├─"test/test_expect_test.ml":381:16: _baz
    │ └─_baz = 18
    ├─"test/test_expect_test.ml":381:16: _baz
    │ └─_baz = 20
    └─_baz = <max_num_children exceeded>
    Raised exception: ppx_minidebug: max_num_children exceeded
    |}]
The %debug_interrupts extension point emits the interrupt checks in a lexically delimited scope. For convenience, we offer the extension point %global_debug_interrupts which triggers emitting the interrupt checks in the remainder of the source preprocessed in the same process (its scope is therefore less well defined). For example:
module Debug_runtime =
  (val Minidebug_runtime.debug_flushing ~filename:"debugger_show_interrupts" ())

[%%global_debug_interrupts { max_nesting_depth = 5; max_num_children = 10 }]
[%%global_debug_type_info true]

let%debug_o_show rec loop_exceeded (x : int) : int =
  let z : int = (x - 1) / 2 in
  if x <= 0 then 0 else z + loop_exceeded (z + (x / 2))
If that is insufficient, you can define _get_local_debug_runtime using a _flushing builder. The logged traces are still indented, but if the values to print are multi-line, their formatting might be messy. The benefit of "flushing" traces is that the output is flushed line-at-a-time, so no output should be lost if the traced program crashes. But in recent versions of ppx_minidebug, uncaught exceptions no longer break logging. The indentation is also smaller (half of the PrintBox runtimes). Example:
  let _get_local_debug_runtime =
    Minidebug_runtime.prefixed_runtime_flushing ~time_tagged:Not_tagged
      ~global_prefix:"test-51" ()
  in
  let%debug_show bar (x : t) : int =
    let y : int = x.first + 1 in
    x.second * y
  in
  let () = print_endline @@ Int.to_string @@ bar { first = 7; second = 42 } in
  let%debug_show baz (x : t) : int =
    let ((y, z) as _yz) : int * int = (x.first + 1, 3) in
    (x.second * y) + z
  in
  let () = print_endline @@ Int.to_string @@ baz { first = 7; second = 42 } in
  let output = [%expect.output] in
  print_endline output;
  [%expect
    {|
    BEGIN DEBUG SESSION test-51
    test-51 bar begin "test/test_expect_test.ml":157:21:
     test-51 x = { Test_expect_test.first = 7; second = 42 }
     test-51 y begin "test/test_expect_test.ml":158:8:
      test-51 y = 8
     test-51 y end
     test-51 bar = 336
    test-51 bar end
    336
    test-51 baz begin "test/test_expect_test.ml":162:21:
     test-51 x = { Test_expect_test.first = 7; second = 42 }
     test-51 _yz begin "test/test_expect_test.ml":163:19:
      test-51 _yz = (8, 3)
     test-51 _yz end
     test-51 baz = 339
    test-51 baz end
    339
    |}]
Tracking: control flow branches, anonymous and insufficiently annotated functions
Using the %track_-prefix rather than %debug_-prefix to start a debug scope, or using the %debug_trace extension point inside a debug scope, enables more elaborate tracking of the execution path. It logs which if, match, function branch is taken. It logs the nesting and loop index of for loops, and the nesting of while loops. It logs functions even if the return type is not annotated, including anonymous functions; in particular, it logs type-annotated arguments of anonymous functions. To selectively disable these logs, use %debug_notrace. Note that it disables the logs on a lexical scope, not just on the annotated syntax node (e.g. a specific if or match expression).
If you get fewer logs than you expected, try converting %debug_ to %track_.
Example that also illustrates disabling tracing:
  let _get_local_debug_runtime =
    Minidebug_runtime.prefixed_runtime ~values_first_mode:false ()
  in
  let%track_show track_branches (x : int) : int =
    if x < 6 then
      match%debug_notrace x with
      | 0 -> 1
      | 1 -> 0
      | _ ->
          let result : int = if x > 2 then x else ~-x in
          result
    else
      match x with
      | 6 -> 5
      | 7 -> 4
      | _ ->
          let result : int = if x < 10 then x else ~-x in
          result
  in
  let () =
    try
      print_endline @@ Int.to_string @@ track_branches 8;
      print_endline @@ Int.to_string @@ track_branches 3
    with _ -> print_endline "Raised exception."
  in
  [%expect
    {|
    BEGIN DEBUG SESSION
    "test/test_expect_test.ml":1037:32: track_branches
    ├─x = 8
    ├─"test/test_expect_test.ml":1046:6: else:test_expect_test:1046
    │ └─"test/test_expect_test.ml":1050:10: <match -- branch 2>
    │   └─"test/test_expect_test.ml":1050:14: result
    │     ├─"test/test_expect_test.ml":1050:44: then:test_expect_test:1050
    │     └─result = 8
    └─track_branches = 8
    8
    "test/test_expect_test.ml":1037:32: track_branches
    ├─x = 3
    ├─"test/test_expect_test.ml":1039:6: then:test_expect_test:1039
    │ └─"test/test_expect_test.ml":1043:14: result
    │   └─result = 3
    └─track_branches = 3
    3
    |}]
Another example:
  let%track_show anonymous (x : int) =
    Array.fold_left ( + ) 0 @@ Array.init (x + 1) (fun (i : int) -> i)
  in
  let () =
    try print_endline @@ Int.to_string @@ anonymous 3
    with Failure s -> print_endline @@ "Raised exception: " ^ s
  in
  [%expect
    {|
    "test/test_expect_test.ml":1231:27: anonymous
    ├─x = 3
    ├─"test/test_expect_test.ml":1232:50: fun:test_expect_test:1232
    │ └─i = 0
    ├─"test/test_expect_test.ml":1232:50: fun:test_expect_test:1232
    │ └─i = 1
    ├─"test/test_expect_test.ml":1232:50: fun:test_expect_test:1232
    │ └─i = 2
    └─"test/test_expect_test.ml":1232:50: fun:test_expect_test:1232
      └─i = 3
    6
    |}]
To disable, rather than enhance, debugging for a piece of code, you can use the %diagn_ extension points.
Explicit logging statements also help with tracking the execution, since they can be placed anywhere within a debug scope. Example from the test suite:
  let _get_local_debug_runtime =
    Minidebug_runtime.prefixed_runtime ~values_first_mode:false ()
  in
  let%track_sexp result =
    let i = ref 0 in
    let j = ref 0 in
    while !i < 6 do
      [%log 1, "i=", (!i : int)];
      incr i;
      [%log 2, "i=", (!i : int)];
      j := !j + !i;
      [%log 3, "j=", (!j : int)]
    done;
    !j
  in
  print_endline @@ Int.to_string result;
  [%expect
    {|
    BEGIN DEBUG SESSION
    "test/test_expect_test.ml":2576:17: result
    └─"test/test_expect_test.ml":2579:4: while:test_expect_test:2579
      ├─"test/test_expect_test.ml":2580:6: <while loop>
      │ ├─(1 i= 0)
      │ ├─(2 i= 1)
      │ └─(3 j= 1)
      ├─"test/test_expect_test.ml":2580:6: <while loop>
      │ ├─(1 i= 1)
      │ ├─(2 i= 2)
      │ └─(3 j= 3)
      ├─"test/test_expect_test.ml":2580:6: <while loop>
      │ ├─(1 i= 2)
      │ ├─(2 i= 3)
      │ └─(3 j= 6)
      ├─"test/test_expect_test.ml":2580:6: <while loop>
      │ ├─(1 i= 3)
      │ ├─(2 i= 4)
      │ └─(3 j= 10)
      ├─"test/test_expect_test.ml":2580:6: <while loop>
      │ ├─(1 i= 4)
      │ ├─(2 i= 5)
      │ └─(3 j= 15)
      └─"test/test_expect_test.ml":2580:6: <while loop>
        ├─(1 i= 5)
        ├─(2 i= 6)
        └─(3 j= 21)
    21
    |}]
Using as a logging framework
ppx_minidebug can be used as a logging framework: its annotations can be stored permamently with the source code, rather than shyly added for a brief period of debugging. To allow this, there needs to be a mechanism of logging levels -- otherwise the system is slowed down too much, or even if performance is not an issue, the user is overwhelmed with the amount of logs. ppx_minidebug addresses these issues in a flexible way, by offering restriction of log levels both at compile time and at runtime.
The %diagn_ extension points (short for "diagnostic") are tailored for the "logging framework" use-case. Within the scope of a %diagn_ extension point, only explicit logs are generated. Therefore, one can freely add type annotations without generating debug logs. As a side-effect, %diagn_ annotations can be used to disable debugging for pieces of code where we need type annotations for code reasons, but do not have serialization/printing functions for the types.
In the PrintBox backend, logs accumulate until the current toplevel log scope is closed. This is unfortunate in the logging framework context, where promptly informing the user using the logs might be important. To remedy this, PrintBox_runtime offers the setting snapshot_every_sec. When set, if sufficient time has passed since the last output, the backend will output the whole current toplevel log scope. If possible, the previous snapshot of the same log scope is erased, to not duplicate information. The underlying mechanism is available as [snapshot] in the generic interface; it does nothing in the flushing backend. [snapshot] is useful when there's a risk of a "premature" exit of the debugged program or thread.
The log levels are integers intended to be within the range 0-9, where 0 means no logging at all. They can be provided explicitly by all extension entry points and all explicit logging extensions. When omitted, the log level of the enclosing log entry is used; the default for a top-level log entry is log level 1. The syntax for logging at a compile-time given level is by example: %debug2_sexp (log at level 2), %log3 (log at level 3), %log1_resut (log result at level 1), %diagn3_sexp (log at level 3) etc.
The %diagn_ extension points further restrict logging to explicit logs only. Example from the test suite:
  let _get_local_debug_runtime = Minidebug_runtime.prefixed_runtime () in
  let%diagn_show bar { first : int; second : int } : int =
    let { first : int = a; second : int = b } = { first; second = second + 3 } in
    let y : int = a + 1 in
    [%log "for bar, b-3", (b - 3 : int)];
    (b - 3) * y
  in
  let () = print_endline @@ Int.to_string @@ bar { first = 7; second = 42 } in
  let%diagn_show baz { first : int; second : int } : int =
    let foo { first : int; second : int } : int =
      [%log "foo baz, f squared", (first * first : int)];
      (first * first) + second
    in
    foo { first; second }
  in
  let () = print_endline @@ Int.to_string @@ baz { first = 7; second = 42 } in
  [%expect
    {|
    BEGIN DEBUG SESSION
    bar
    ├─"test/test_expect_test.ml":3302:21
    └─("for bar, b-3", 42)
    336
    baz
    ├─"test/test_expect_test.ml":3309:21
    └─("foo baz, f squared", 49)
    91
    |}]
At runtime creation, the level can be set via the ~log_level parameter, or via Debug_runtime.log_level := ... later on, also for the flushing backend. The following example also illustrates the _rt_ runtime-passing entry points:
  let%track_rt_sexp result () : int =
    let i = ref 0 in
    let j = ref 0 in
    while !i < 6 do
      (* Intentional empty but not omitted else-branch. *)
      if !i < 2 then [%log1 "ERROR:", 1, "i=", (!i : int)] else ();
      incr i;
      [%log2 "WARNING:", 2, "i=", (!i : int)];
      j := (fun { contents } -> !j + contents) i;
      [%log3 "INFO:", 3, "j=", (!j : int)]
    done;
    !j
  in
  print_endline
  @@ Int.to_string
       (result
          Minidebug_runtime.(
            forget_printbox
            @@ debug ~values_first_mode:false ~global_prefix:"Everything" ())
          ());
  print_endline
  @@ Int.to_string
       (result
          Minidebug_runtime.(
            forget_printbox
            @@ debug ~values_first_mode:false ~log_level:0 ~global_prefix:"Nothing" ())
          ());
  print_endline
  @@ Int.to_string
       (result
          Minidebug_runtime.(
            forget_printbox @@ debug ~log_level:1 ~global_prefix:"Error" ())
          ());
But there is a more convenient approach. Both at compile time (constant) and at runtime (integer expression), the level can be set for a scope with %log_level, or globally with %global_debug_log_level. (%log_level is not registered to minimize incompatibility with other logging frameworks.) The (default) compile-time level can also be set silently via the environment variable PPX_MINIDEBUG_DEFAULT_COMPILE_LOG_LEVEL (unsafe). The extensions %global_debug_log_level, %log_level set the compile time log level only when used with an integer literal, otherwise they are limited to setting the runtime log level.
For example:
let _get_local_debug_runtime =
  Minidebug_runtime.local_runtime_flushing "debugger_show_log_prefixed"

[%%global_debug_log_level 2]

let%diagn_show rec loop_exceeded (x : int) : int =
  let z : int =
    [%log2 "inside loop", (x : int)];
    [%log3 "this is detail"];
    (x - 1) / 2
  in
  if x <= 0 then 0 else z + loop_exceeded (z + (x / 2))
This will not emit logging code that is above the stated log level. Note that the compile-time pruning of logging happens independently of the runtime log level! This gives more flexibility but can lead to confusing situations.
Currently %log_level adjusts the log level both in the lexical scope and the dynamic scope. These functionalities could in principle be separated.
You can set the compile time log level by setting the environment variable PPX_MINIDEBUG_DEFAULT_COMPILE_LOG_LEVEL -- this provides a default that will be overriden by all the other configuration options. This approach is error prone since all your projects and files will share the same configuration, and there is no consistency checking; use at your own risk. Some errors can be avoided by adding (preprocessor_deps (env_var PPX_MINIDEBUG_DEFAULT_COMPILE_LOG_LEVEL)) in dune files.
There's also a way to compile the code adaptively, using any shell environment variable: [%%global_debug_log_level_from_env_var "environment_variable_name"]. The variable name is case-sensitive, the values should be integers. I recommend configuring this in every affected file, otherwise the behavior is unspecified.
With [%%global_debug_log_level_from_env_var "environment_variable_name"], the generated code will check that the compile-time adaptive pruning matches the runtime value of the environment variable. If that's an obstacle, use %%global_debug_log_level_from_env_var_unsafe which will not perform the check. Using %%global_debug_log_level_from_env_var_unsafe or PPX_MINIDEBUG_DEFAULT_COMPILE_LOG_LEVEL can be prone to workflow bugs where different parts of a codebase are compiled with different log levels, leading to confusing behavior. In any case, I recommend adding a dependency on the environment variable to the dune file: for libraries, that would be (preprocessor_deps (env_var environment_variable_name)).
Another example from the test suite, notice how the log level of %log1 overrides the parent log level of %debug3_show:
  let _get_local_debug_runtime = Minidebug_runtime.prefixed_runtime ~log_level:2 () in
  let%debug3_show () =
    let foo { first : int; second : int } : int =
      let { first : int = a; second : int = b } = { first; second = second + 3 } in
      let y : int = a + 1 in
      [%log "for foo, b-3", (b - 3 : int)];
      (b - 3) * y
    in
    let bar { first : int; second : int } : int =
      let { first : int = a; second : int = b } = { first; second = second + 3 } in
      let y : int = a + 1 in
      [%log1 "for bar, b-3", (b - 3 : int)];
      (b - 3) * y
    in
    let%debug2_show baz { first : int; second : int } : int =
      let { first : int; second : int } = { first = first + 1; second = second + 3 } in
      [%log "for baz, f squared", (first * first : int)];
      (first * first) + second
    in
    print_endline @@ Int.to_string @@ foo { first = 7; second = 42 };
    print_endline @@ Int.to_string @@ bar { first = 7; second = 42 };
    print_endline @@ Int.to_string @@ baz { first = 7; second = 42 }
  in
  [%expect
    {|
    BEGIN DEBUG SESSION
    336
    ("for bar, b-3", 42)
    └─{orphaned from #5}
    336
    baz = 109
    ├─"test/test_expect_test.ml":3413:24
    ├─first = 7
    ├─second = 42
    ├─{first; second}
    │ ├─"test/test_expect_test.ml":3414:10
    │ └─<values>
    │   ├─first = 8
    │   └─second = 45
    └─("for baz, f squared", 64)
    109
    |}]
The extension point %log_result lets you benefit from the values_first_mode setting even when using only explicit logs. Conveying more information in headers lets you explore logs more quickly.
The extension point %log_printbox lets you embed a PrintBox.t in the logs directly. Example from the test suite:
  let _get_local_debug_runtime = Minidebug_runtime.prefixed_runtime () in
  let%debug_show foo () : unit =
    [%log_printbox
      PrintBox.init_grid ~line:5 ~col:5 (fun ~line ~col ->
          PrintBox.sprintf "%d/%d" line col)];
    [%log "No bars but pad:"];
    [%log_printbox
      PrintBox.(
        init_grid ~bars:false ~line:5 ~col:5 (fun ~line ~col ->
            pad @@ sprintf "%d/%d" line col))];
    [%log "Now with a frame:"];
    [%log_printbox
      PrintBox.(
        frame
        @@ init_grid ~line:5 ~col:5 (fun ~line ~col -> PrintBox.sprintf "%d/%d" line col))]
  in
  let () = foo () in
  [%expect
    {|
    BEGIN DEBUG SESSION
    foo = ()
    ├─"test/test_expect_test.ml":3544:21
    ├─0/0│0/1│0/2│0/3│0/4
    │ ───┼───┼───┼───┼───
    │ 1/0│1/1│1/2│1/3│1/4
    │ ───┼───┼───┼───┼───
    │ 2/0│2/1│2/2│2/3│2/4
    │ ───┼───┼───┼───┼───
    │ 3/0│3/1│3/2│3/3│3/4
    │ ───┼───┼───┼───┼───
    │ 4/0│4/1│4/2│4/3│4/4
    ├─"No bars but pad:"
    ├─
    │  0/0  0/1  0/2  0/3  0/4
    │
    │
    │  1/0  1/1  1/2  1/3  1/4
    │
    │
    │  2/0  2/1  2/2  2/3  2/4
    │
    │
    │  3/0  3/1  3/2  3/3  3/4
    │
    │
    │  4/0  4/1  4/2  4/3  4/4
    │
    ├─"Now with a frame:"
    └─┬───┬───┬───┬───┬───┐
      │0/0│0/1│0/2│0/3│0/4│
      ├───┼───┼───┼───┼───┤
      │1/0│1/1│1/2│1/3│1/4│
      ├───┼───┼───┼───┼───┤
      │2/0│2/1│2/2│2/3│2/4│
      ├───┼───┼───┼───┼───┤
      │3/0│3/1│3/2│3/3│3/4│
      ├───┼───┼───┼───┼───┤
      │4/0│4/1│4/2│4/3│4/4│
      └───┴───┴───┴───┴───┘
    |}]
The extension point %log_entry lets you shape arbitrary log tree structures. The similar extension point %log_block ensures that its body doesn't get executed (resp. generated) when the current runtime (resp. compile-time) log level is inadequate. Example:
  let _get_local_debug_runtime =
    Minidebug_runtime.prefixed_runtime ~values_first_mode:false ()
  in
  let%diagn_show _logging_logic : unit =
    let rec loop logs =
      match logs with
      | "start" :: header :: tl ->
          let more =
            [%log_entry
              header;
              loop tl]
          in
          loop more
      | "end" :: tl -> tl
      | msg :: tl ->
          [%log msg];
          loop tl
      | [] -> []
    in
    ignore
    @@ loop
         [
           "preamble";
           "start";
           "header 1";
           "log 1";
           "start";
           "nested header";
           "log 2";
           "end";
           "log 3";
           "end";
           "start";
           "header 2";
           "log 4";
           "end";
           "postscript";
         ]
  in
  [%expect
    {|
    BEGIN DEBUG SESSION
    "test/test_expect_test.ml":3679:17: _logging_logic
    ├─"preamble"
    ├─header 1
    │ ├─"log 1"
    │ ├─nested header
    │ │ └─"log 2"
    │ └─"log 3"
    ├─header 2
    │ └─"log 4"
    └─"postscript"
    |}]
%log_result, %log_printbox, %log_entry, %log_block also allow log-level specifications (e.g. %log2_block).
Specifying the level to log at via a runtime expression
The unregistered extension point [%at_log_level for_log_level; <body>] sets the default log level for logging expressions within <body> to for_log_level, which can be any expression with integer type.
To express the runtime-known levels to log at more concisely, we have extension points %logN, %logN_result, %logN_printbox, %logN_block (but not other extension points), by analogy to compile time levels where instead of the letter N there is a digit 1-9. With the letter N, the extension expressions take an extra argument that is the level to log at. For example, [%logN for_log_level; "message"] will log "message" when at runtime, for_log_level's value is at or below the current log level.
In particular, [%logN_block for_log_level "header"; Printf.printf "level %d" for_log_level] is roughly equivalent to:
let _get_local_debug_runtime = Minidebug_runtime.local_runtime "sync_to_md-at_log_level"

let%debug_sexp test_at_log_level for_log_level : unit =
  if !Debug_runtime.log_level >= for_log_level then
    [%at_log_level
      for_log_level;
      [%log_entry
        "header";
        Printf.printf "level %d" for_log_level]]

let%debug_sexp _test_at_log_level_2 : unit = test_at_log_level 2
let%debug_sexp _test_at_log_level_3 : unit = test_at_log_level 3
Take a look at the test "%logN_block runtime log levels" in test_expect_test.ml:
  let%track_rt_sexp result ~for_log_level : int =
    let i = ref 0 in
    let j = ref 0 in
    while !i < 6 do
      incr i;
      [%logN_block
        for_log_level ("i=" ^ string_of_int !i);
        if !i < 3 then [%log "ERROR:", 1, "i=", (!i : int)] else ();
        [%log "WARNING:", 2, "i=", (!i : int)];
        j := (fun { contents } -> !j + contents) i;
        [%log3 "INFO:", 3, "j=", (!j : int)]]
    done;
    !j
  in
Lexical scopes vs. dynamic scopes
We track lexical scoping: every log has access to the entry_id number of the lexical scope it is in. Lexical scopes are computations: bindings, functions, tracked code branches (even if not annotated with an extension point, but always within some ppx_minidebug registered extension point). There is also dynamic scoping: which entry a particular log actually ends up belonging in. We do not expose the (lexical) entry id of an individual log, except when the log "wandered" out of all dynamic scopes, or you passed ~verbose_entry_ids:true when creating a runtime. To be able to locate where such log originates from, pass ~print_entry_ids:true when creating the runtime, and look for the path line with the log's entry id. When the backend is HTML or Markdown, the entry id is a hyperlink to the anchor of the entry. Example from the test suite:
  let _get_local_debug_runtime =
    Minidebug_runtime.prefixed_runtime ~print_entry_ids:true ()
  in
  let i = 3 in
  let pi = 3.14 in
  let l = [ 1; 2; 3 ] in
  (* Messing with the structure of the logs might lead to confusing output. *)
  let foo1 = ref @@ fun () -> () in
  let foo2 = ref @@ fun () -> () in
  let%debug_show bar callback : unit =
    foo1 :=
      fun () ->
        [%log "This is like", (i : int), "or", (pi : float), "above"];
        [%log "tau =", (pi *. 2. : float)];
        callback ()
  in
  let%debug_show baz callback : unit =
    foo2 :=
      fun () ->
        [%log i :: (l : int list)];
        [%log (i : int) :: l];
        callback ()
  in
  let () =
    bar !foo2;
    baz !foo1;
    bar !foo2
  in
  let%debug_show _foobar : unit = !foo1 () in
  let () = !foo2 () in
  [%expect
    {|
    BEGIN DEBUG SESSION
    bar = ()
    └─"test/test_expect_test.ml":3168:21 {#1}
    baz = ()
    └─"test/test_expect_test.ml":3175:21 {#2}
    bar = ()
    └─"test/test_expect_test.ml":3168:21 {#3}
    _foobar = ()
    ├─"test/test_expect_test.ml":3187:17 {#4}
    ├─("This is like", 3, "or", 3.14, "above")
    ├─("tau =", 6.28)
    ├─[3; 1; 2; 3]
    ├─[3; 1; 2; 3]
    ├─("This is like", 3, "or", 3.14, "above")
    └─("tau =", 6.28)
    [3; 1; 2; 3]
    └─{orphaned from #2}
    [3; 1; 2; 3]
    └─{orphaned from #2}
    ("This is like", 3, "or", 3.14, "above")
    └─{orphaned from #1}
    ("tau =", 6.28)
    └─{orphaned from #1}
    |}]
~verbose_entry_ids:true tags all logs with entry ids, it shouldn't be needed in regular use.
Reducing the size of generated logs
Summary of possibilities:
- log levels
no_debug_ifprune_uptotruncate_childrensplit_files_after- HTML browsers can handle really large files (less luck with Markdown).
The log levels discussed in the previous section certainly reduce the amount generated, but they either help too little or they remove logs too indiscriminately for use in a debugging context. Dynamically controlling the runtime log level is one option, but there are some other options.
In the PrintBox backend, you can disable the logging of specified subtrees, when the output is irrelevant, would be a distraction, or the logs take up too much space. The test suite example:
  let%debug_show rec loop_changes (x : int) : int =
    let z : int = (x - 1) / 2 in
    (* The call [x = 2] is not printed because it is a descendant of the no-debug call [x
       = 4]. *)
    Debug_runtime.no_debug_if (x <> 6 && x <> 2 && (z + 1) * 2 = x);
    if x <= 0 then 0 else z + loop_changes (z + (x / 2))
  in
  let () = print_endline @@ Int.to_string @@ loop_changes 7 in
  [%expect
    {|
    "test/test_expect_test.ml":247:34: loop_changes
    ├─x = 7
    ├─"test/test_expect_test.ml":248:8: z
    │ └─z = 3
    ├─"test/test_expect_test.ml":247:34: loop_changes
    │ ├─x = 6
    │ ├─"test/test_expect_test.ml":248:8: z
    │ │ └─z = 2
    │ ├─"test/test_expect_test.ml":247:34: loop_changes
    │ │ ├─x = 5
    │ │ ├─"test/test_expect_test.ml":248:8: z
    │ │ │ └─z = 2
    │ │ └─loop_changes = 4
    │ └─loop_changes = 6
    └─loop_changes = 9
    9
    |}]
The no_debug_if mechanism requires modifying the logged sources, and since it's limited to cutting out subtrees of the logs, it can be tricky to select and preserve the context one wants. The highlighting mechanism with the prune_upto setting avoids these problems. You provide a search term without modifying the debugged sources. You can tune the pruning level to keep the context around the place the search term was found.
Setting the option truncate_children will only log the given number of children at each node, prioritizing the most recent ones. An example from the test suite:
  let _get_local_debug_runtime =
    Minidebug_runtime.prefixed_runtime ~values_first_mode:false ~truncate_children:10 ()
  in
  let () =
    try
      let%track_show _bar : unit =
        for i = 0 to 30 do
          let _baz : int = i * 2 in
          ()
        done
      in
      ()
    with Failure s -> print_endline @@ "Raised exception: " ^ s
  in
  [%expect
    {|
    BEGIN DEBUG SESSION
    "test/test_expect_test.ml":515:21: _bar
    ├─"test/test_expect_test.ml":516:8: for:test_expect_test:516
    │ ├─<earlier entries truncated>
    │ ├─i = 26
    │ ├─"test/test_expect_test.ml":516:12: <for i>
    │ │ └─"test/test_expect_test.ml":517:14: _baz
    │ │   └─_baz = 52
    │ ├─i = 27
    │ ├─"test/test_expect_test.ml":516:12: <for i>
    │ │ └─"test/test_expect_test.ml":517:14: _baz
    │ │   └─_baz = 54
    │ ├─i = 28
    │ ├─"test/test_expect_test.ml":516:12: <for i>
    │ │ └─"test/test_expect_test.ml":517:14: _baz
    │ │   └─_baz = 56
    │ ├─i = 29
    │ ├─"test/test_expect_test.ml":516:12: <for i>
    │ │ └─"test/test_expect_test.ml":517:14: _baz
    │ │   └─_baz = 58
    │ ├─i = 30
    │ └─"test/test_expect_test.ml":516:12: <for i>
    │   └─"test/test_expect_test.ml":517:14: _baz
    │     └─_baz = 60
    └─_bar = ()
    |}]
If you provide the split_files_after setting, the logging will transition to a new file after the current file exceeds the given number of characters. However, the splits only happen at the "toplevel", to not interrupt laying out the log trees. If required, you can remove logging indicators from your high-level functions, to bring the deeper logic log trees to the toplevel. This matters when you prefer Markdown output over HTML output -- in my experience, Markdown renderers (VS Code Markdown Preview, GitHub Preview) fail for files larger than 2MB, while browsers easily handle HTML files of over 200MB (including via VS Code Live Preview).
Navigating large logs
There are a few ways ppx_minidebug is helpful with large logs. You can:
- Use the HTML backend with foldable trees. Unlike with the Markdown backend, HTML browsers can render really large files.
- Set
elapsed_times to see how much time was spent in a subtree even if it is folded. - Use
~time_tagged:Elapsed to keep track of when in the course of the program particular entries are computed. - Enable the Table of Contents feature by e.g. passing
~with_toc_listing:true; tune toc_entry so that the tables of contents are concise enough to provide an overview.
The table of contents generation is enabled via ~with_toc_listing:true or ~toc_flame_graph:true or both (for file-based runtimes -- via table_of_contents_ch for channel-based runtimes). This will create an additional file (name ending in -toc), mirroring the main logs in a summarized way. Selected log headers are output there preserving the tree structure, and for ~with_toc_listing:true they look the same as in the main file except there is no folding. The headers are hyperlinks pointing to the main log file (or files, if file splitting is enabled). For ~toc_flame_graph:true, the entries are put in boxes, like in the depicted example from the test suite. Presenting two configurations here:
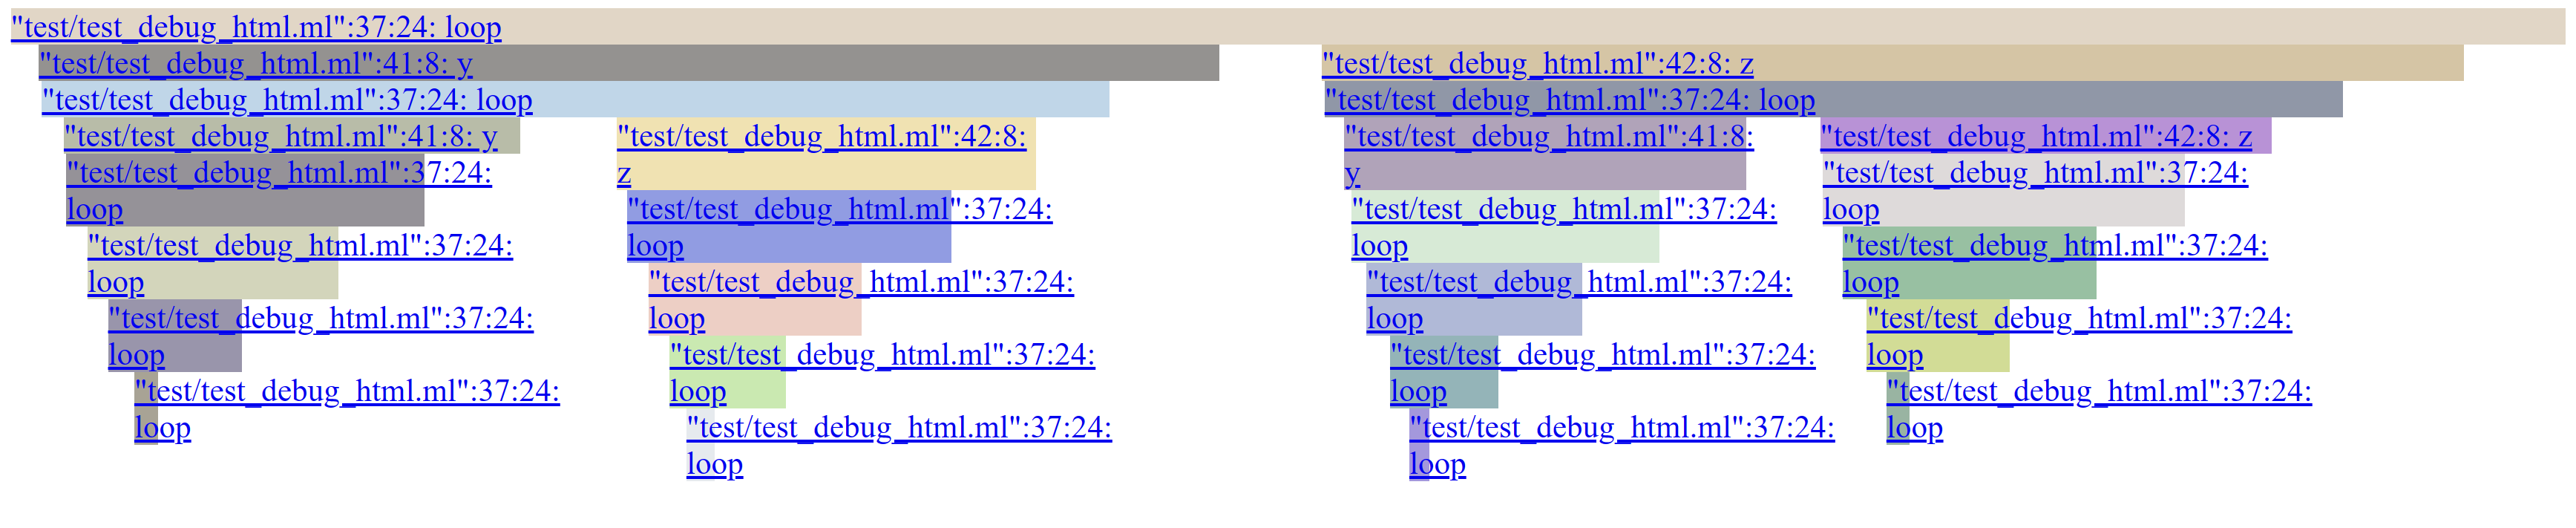
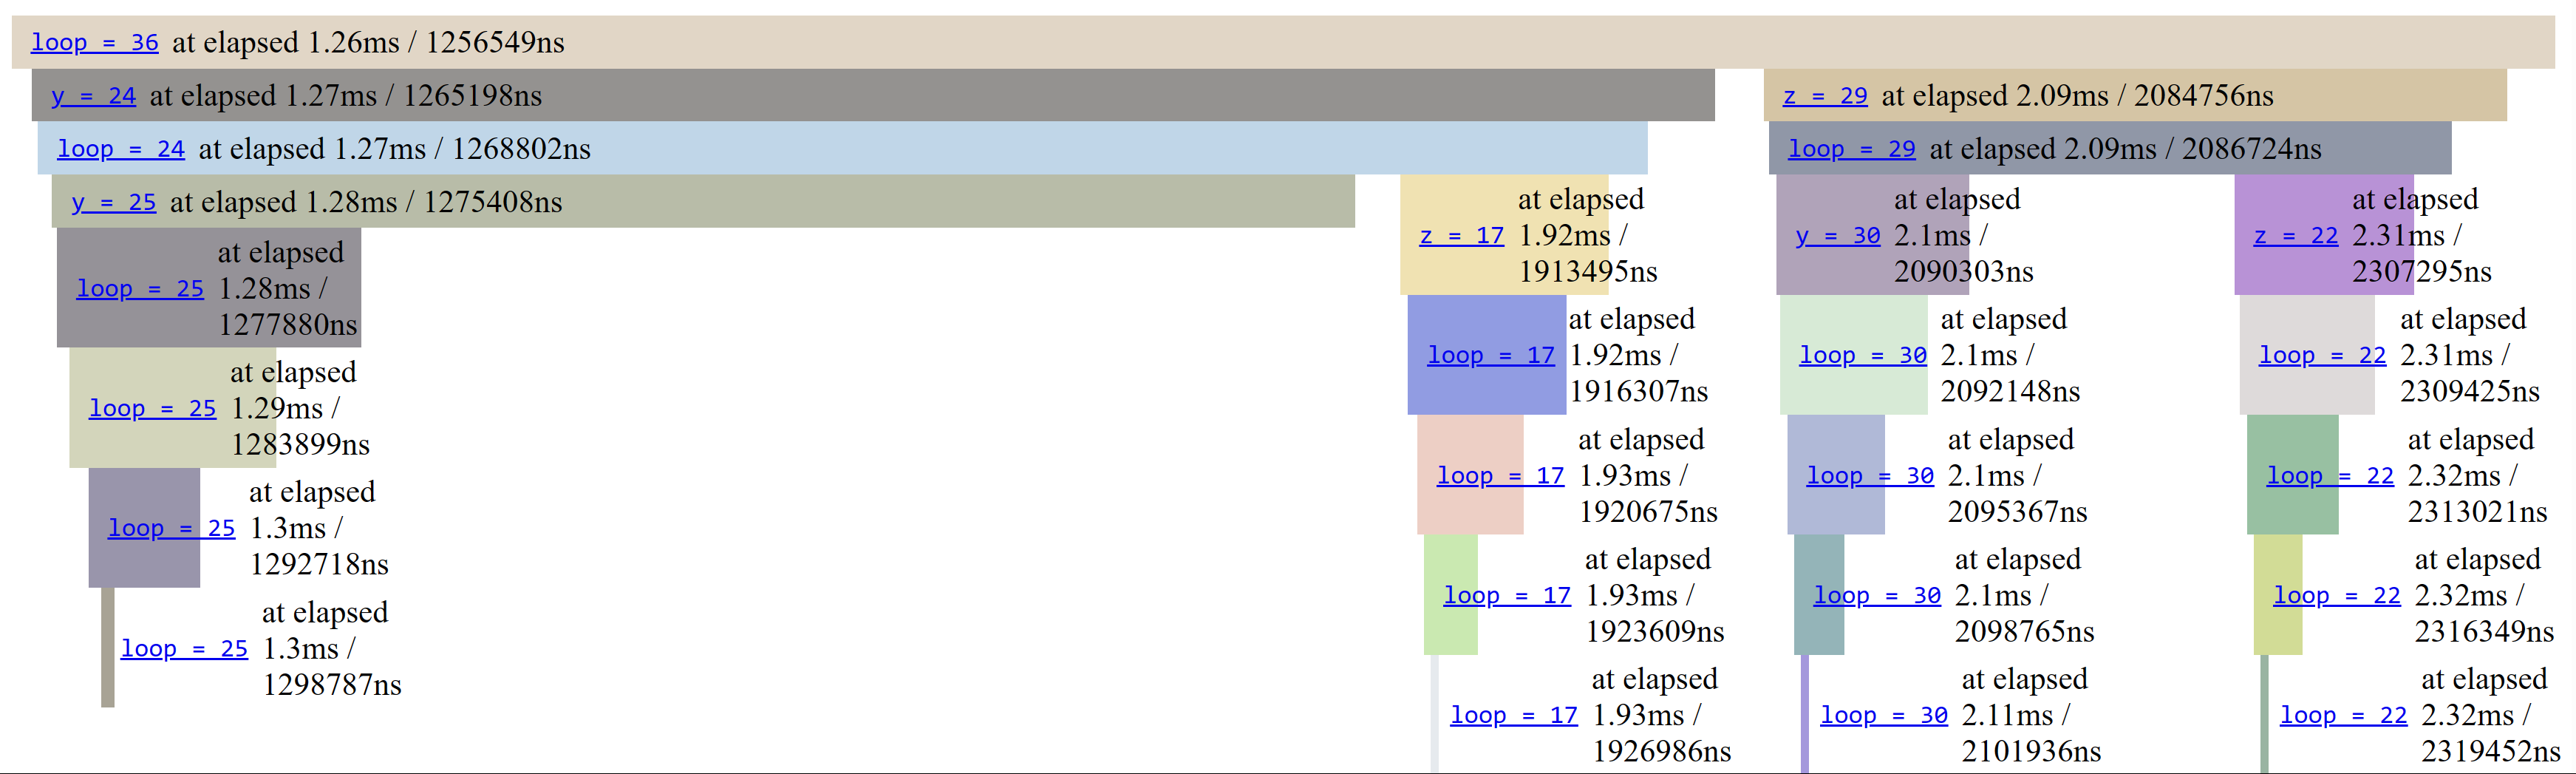
Note: if your flame graph trees run into each other, try setting ~flame_graph_separation:50 or higher.
If you collaborate with someone or take notes, you can pass ~print_entry_ids:true. In HTML and Markdown, this will output links to the anchors of the corresponding log entries. You can share them to point to specific log file locations.
Example demonstrating foldable trees in Markdown:
let _get_local_debug_runtime =
  Minidebug_runtime.local_runtime ~elapsed_times:Microseconds ~hyperlink:"./"
    ~backend:(`Markdown Minidebug_runtime.default_md_config) ~truncate_children:4
    "debugger_sexp_time_spans"

let sexp_of_int i = Sexplib0.Sexp.Atom (string_of_int i)

let () =
  let%debug_sexp rec loop (x : int) : int =
    Array.fold_left ( + ) 0
    @@ Array.init
         (20 / (x + 1))
         (fun i ->
           let z : int = i + ((x - 1) / 2) in
           if x <= 0 then i else i + loop (z + (x / 2) - i))
  in
  print_endline @@ Int.to_string @@ loop 3
Inlined example output, using the Markdown backend for PrintBox. Note that the elapsed time is wallclock time (see mtime) and is due to fluctuate because of e.g. garbage collection or external system events.
loop = 58435 <21456.80μs>
We only implicitly log values of identifiers, located inside patterns, for which the type is provided in the source code, in a syntactically close / related location. PPX rewriters do not have access to the results of type inference. We extract the available type information, but we don't do it perfectly. We propagate type information top-down, merging it, but we do not unify or substitute type variables.
Here is a probably incomplete list of the restrictions:
- When types for a (sub) pattern are specified in multiple places, they are combined by matching syntactically, the type variable alternatives are discarded. The type that is closer to the (sub) pattern is preferred, even if selecting a corresponding type in another place would be better.
When faced with a binding of a form: let pattern = (expression : type_), we make use of type_, but we ignore all types nested inside expression, even if we decompose pattern.
- For example,
let%track_sexp (x, y) = ((5, 3) : int * int) works -- logs both x and y. Also work: let%track_sexp ((x, y) : int * int) = (5, 3) and let%track_sexp ((x : int), (y : int)) = (5, 3). But let%track_sexp (x, y) = ((5 : int), (3 : int)) will not log anything!
We ignore record and variant datatypes when processing record and variant constructor cases. That's because there is no generic(*) way to extract the types of the arguments.
Another example of only propagating types top-down:
let%track_show f (l : int option) : int = match l with Some y -> ... will not log y when f is applied (but it will log l).- Both
let%track_show f : int option -> int = function Some y -> ... and let%track_show f l : int = match (l : int option) with Some y -> ... will log y.
- We try reconstructing or guessing the types of expressions logged with
%log and %log_result, see details below.
As a help in debugging whether the right type information got propagated, we offer the extension %debug_type_info (and %global_debug_type_info). (The display strips module qualifiers from types.) %debug_type_info is not an entry extension point (%global_debug_type_info is). Example from the test suite:
  let _get_local_debug_runtime = Minidebug_runtime.prefixed_runtime () in
  [%debug_show
    [%debug_type_info
      let f : 'a. 'a -> int -> int = fun _a b -> b + 1 in
      let g : 'a. 'a -> int -> 'a -> 'a -> int = fun _a b _c _d -> b * 2 in
      let () = print_endline @@ Int.to_string @@ f 'a' 6 in
      print_endline @@ Int.to_string @@ g 'a' 6 'b' 'c']];
  [%expect
    {|
    BEGIN DEBUG SESSION
    f : int = 7
    ├─"test/test_expect_test.ml":2242:37
    ├─f : int
    └─b : int = 6
    7
    g : int = 12
    ├─"test/test_expect_test.ml":2243:49
    ├─g : int
    └─b : int = 6
    12
    |}]
You can also use at the module level: [%%global_debug_type_info true], prior to the code of interest.
Explicit logging with %log (and %log_result) has different but related restrictions compared to logging of let or argument bindings. We reconstruct the type of the expression from partial type information, where in addition to type annotations we take into account: string, int and float literals, tuple, array, list, and lazy expresssions. We do not analyze applications, nor constructors other than "nil" [] and "cons" :: for lists. When a type is unknown, for the whole expression and for a tuple element we assume the type string. We don't assume string for direct subexpressions of arrays, lists, and lazy.
Dealing with concurrent execution
With version 2.2.0, the default safety of using ppx_minidebug in a multithreaded context improved significantly. That's because the most convenient runtime builders (local_runtime etc.) use thread-local storage to provide local debug runtimes. They either log to different files, or use prefixes on logs. When using one of the lower-level debug runtime builders, or when using fibers or other non-system multithreading solutions, you need to be careful.
We offer three helpers for dealing with multiple debug runtimes.
The default extension points %debug_sexp, %track_sexp, etc. call a function _get_local_debug_runtime () and unpack the argument as module Debug_runtime (in a function body). The feature helps using a runtime instance dedicated to a thread or domain, since for example _get_local_debug_runtime can retrieve the runtime using Domain.DLS. (The runtime builders local_runtime and local_runtime_flushing use Thread_local_storage.) To avoid surprises, in case of directly annotated functions, this feature unpacks a Debug_runtime inside the function body, so that we get the appropriate runtime for the dynamic local scope.
There is an optional runtime instance-level setting global_prefix, which adds the given information to all log headers (and all logs with prefix_all_logs) coming from the instance. The runtime builders prefixed_runtime and prefixed_runtime_flushing use Thread.id (Thread.self ()) in the prefixes.
Example from the test suite:
  let i = ref 0 in
  let _get_local_debug_runtime () =
    Minidebug_runtime.debug_flushing ~global_prefix:("foo-" ^ string_of_int !i) ()
  in
  let%track_show foo () =
    let () = () in
    [%log "inside foo"]
  in
  let%track_show bar = function
    | () ->
        let () = () in
        [%log "inside bar"]
  in
  while !i < 3 do
    incr i;
    foo ();
    bar ()
  done;
  [%expect
    {|
    BEGIN DEBUG SESSION foo-1
    foo-1 foo begin "test/test_expect_test.ml":3959:21:
     "inside foo"
    foo-1 foo end

    BEGIN DEBUG SESSION foo-1
    foo-1 <function -- branch 0> () begin "test/test_expect_test.ml":3965:8:
     "inside bar"
    foo-1 <function -- branch 0> () end

    BEGIN DEBUG SESSION foo-2
    foo-2 foo begin "test/test_expect_test.ml":3959:21:
     "inside foo"
    foo-2 foo end

    BEGIN DEBUG SESSION foo-2
    foo-2 <function -- branch 0> () begin "test/test_expect_test.ml":3965:8:
     "inside bar"
    foo-2 <function -- branch 0> () end

    BEGIN DEBUG SESSION foo-3
    foo-3 foo begin "test/test_expect_test.ml":3959:21:
     "inside foo"
    foo-3 foo end

    BEGIN DEBUG SESSION foo-3
    foo-3 <function -- branch 0> () begin "test/test_expect_test.ml":3965:8:
     "inside bar"
    foo-3 <function -- branch 0> () end
    |}]
Another similar feature is the extension points %debug_rt_sexp, %track_rt_sexp, etc. They add a first-class module argument to a function, and unpack the argument as module Debug_runtime. At present, passing of the runtime instance to functions needs to be done manually. Note that only the function attached to the _rt_ extension point is modified.
Example from the test suite:
  let%track_rt_show foo l : int = match (l : int list) with [] -> 7 | y :: _ -> y * 2 in
  let () =
    print_endline @@ Int.to_string
    @@ foo Minidebug_runtime.(forget_printbox @@ debug ~global_prefix:"foo-1" ()) [ 7 ]
  in
  let%track_rt_show baz : int list -> int = function
    | [] -> 7
    | [ y ] -> y * 2
    | [ y; z ] -> y + z
    | y :: z :: _ -> y + z + 1
  in
  let () =
    print_endline @@ Int.to_string
    @@ baz Minidebug_runtime.(forget_printbox @@ debug ~global_prefix:"baz-1" ()) [ 4 ]
  in
  let () =
    print_endline @@ Int.to_string
    @@ baz
         Minidebug_runtime.(forget_printbox @@ debug ~global_prefix:"baz-2" ())
         [ 4; 5; 6 ]
  in
  [%expect
    {|
    BEGIN DEBUG SESSION foo-1
    foo = 14
    ├─"test/test_expect_test.ml":2358:24
    └─foo-1 <match -- branch 1> :: (y, _)
      ├─"test/test_expect_test.ml":2358:80
      └─y = 7
    14

    BEGIN DEBUG SESSION baz-1
    baz = 8
    ├─"test/test_expect_test.ml":2365:15
    ├─baz-1 <function -- branch 1> :: (y, [])
    └─y = 4
    8

    BEGIN DEBUG SESSION baz-2
    baz = 10
    ├─"test/test_expect_test.ml":2367:21
    ├─baz-2 <function -- branch 3> :: (y, :: (z, _))
    ├─y = 4
    └─z = 5
    10
    |}]